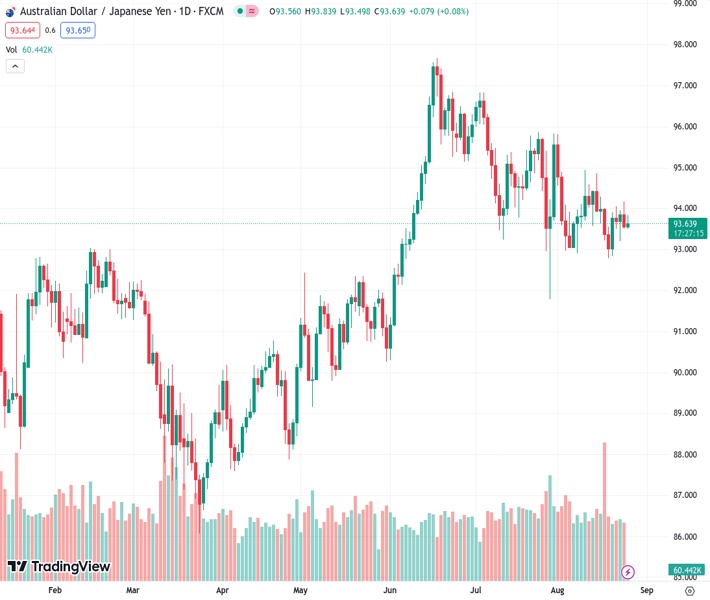
The AUDJPY pair, with a value of 93.6370, experiences some upward movement in the Asian trading session, but it does not continue to rise significantly.
…
This is a premium post.
[s2If !current_user_can(access_s2member_level4)]Please register for FREE REGISTER to read full post below containing analysis. In case of any error or you think you are not able to read the full post below, please email us at support#nehcap.com [lwa][/s2If] [s2If current_user_can(access_s2member_level1)]
- AUD/JPY gains some positive traction during the Asian session, albeit lacks follow-through.
The pair currently trades last at 93.6370.
The previous day high was 94.18 while the previous day low was 93.51. The daily 38.2% Fib levels comes at 93.77, expected to provide resistance. Similarly, the daily 61.8% fib level is at 93.92, expected to provide resistance.
The AUD/JPY cross attracts some dip-buying near the 93.45 region on Friday and reverses a part of the previous day’s retracement slide from over a one-week high. Spot prices, however, struggle to capitalize on the move and remain below the 94.00 round-figure mark through the Asian session, warranting some caution for bullish traders.
The Japanese Yen (JPY) weakens a bit in reaction to data, showing that consumer inflation in Tokyo – Japan’s capital city – grew at a slower-than-expected pace in August, which reaffirms expectations that the Bank of Japan (BoJ) will stick to its dovish stance. This, in turn, provides a modest intraday lift to the AUD/JPY cross, though worries about a deeper global economic downturn keep a lid on further appreciating move for the growth-sensitive Australian Dollar (AUD).
From a technical perspective, spot prices have been oscillating in a familiar range since the early part of the current week. This, in turn, points to an indecision among traders over the next leg of a directional move. Meanwhile, the lack of any meaningful buying and the AUD/JPY pair’s inability to capitalize on its recent bounce from the 100-day Simple Moving Average (SMA) suggests that the recent downtrend witnessed over the past two months or so is still far from being over.
Moreover, oscillators on the daily chart are holding in the negative territory and indicate that the path of least resistance for spot prices is to the downside. That said, it will still be prudent to wait for a sustained break below the 100-day SMA support, currently pegged around the 93.00 round figure, before positioning for deeper losses. The AUD/JPY cross might then accelerate the downfall towards the 92.00 mark en route to the July swing low, around the 91.80-91.75 region.
On the flip side, any positive move might continue to attract fresh sellers above the 94.00 level and is likely to remain capped near the monthly peak, just ahead of the 95.00 psychological mark. A sustained strength beyond the latter will shift the near-term bias in favour of bullish traders and lift the AUD/JPY cross further beyond the 95.30 intermediate resistance en route to the 95.80-95.85 supply zone and the 96.00 round figure for the first time since early July.
Technical Levels: Supports and Resistances
AUDJPY currently trading at 93.64 at the time of writing. Pair opened at 93.58 and is trading with a change of 0.06 % .
| Overview | Overview.1 | |
|---|---|---|
| 0 | Today last price | 93.64 |
| 1 | Today Daily Change | 0.06 |
| 2 | Today Daily Change % | 0.06 |
| 3 | Today daily open | 93.58 |
The pair is trading below its 20 Daily moving average @ 93.91, below its 50 Daily moving average @ 94.87 , above its 100 Daily moving average @ 93.01 and above its 200 Daily moving average @ 91.9
| Trends | Trends.1 | |
|---|---|---|
| 0 | Daily SMA20 | 93.91 |
| 1 | Daily SMA50 | 94.87 |
| 2 | Daily SMA100 | 93.01 |
| 3 | Daily SMA200 | 91.90 |
The previous day high was 94.18 while the previous day low was 93.51. The daily 38.2% Fib levels comes at 93.77, expected to provide resistance. Similarly, the daily 61.8% fib level is at 93.92, expected to provide resistance.
Note the levels of interest below:
- Pivot support is noted at 93.34, 93.09, 92.67
- Pivot resistance is noted at 94.0, 94.42, 94.67
| Levels | Levels.1 |
|---|---|
| Previous Daily High | 94.18 |
| Previous Daily Low | 93.51 |
| Previous Weekly High | 94.87 |
| Previous Weekly Low | 92.79 |
| Previous Monthly High | 96.84 |
| Previous Monthly Low | 91.79 |
| Daily Fibonacci 38.2% | 93.77 |
| Daily Fibonacci 61.8% | 93.92 |
| Daily Pivot Point S1 | 93.34 |
| Daily Pivot Point S2 | 93.09 |
| Daily Pivot Point S3 | 92.67 |
| Daily Pivot Point R1 | 94.00 |
| Daily Pivot Point R2 | 94.42 |
| Daily Pivot Point R3 | 94.67 |
[/s2If]
Download Nehcap EAWe have two EAs that are operational on our LIVE accounts.
- EA-FIX: Check out the details here. Download EA-FIX . EA-FIX is a non-grid HFT scalper.
- EA-GROWTH: High quality low dd EA using trend grids. Download EA_GROWTHJoin Our Telegram Group
")


