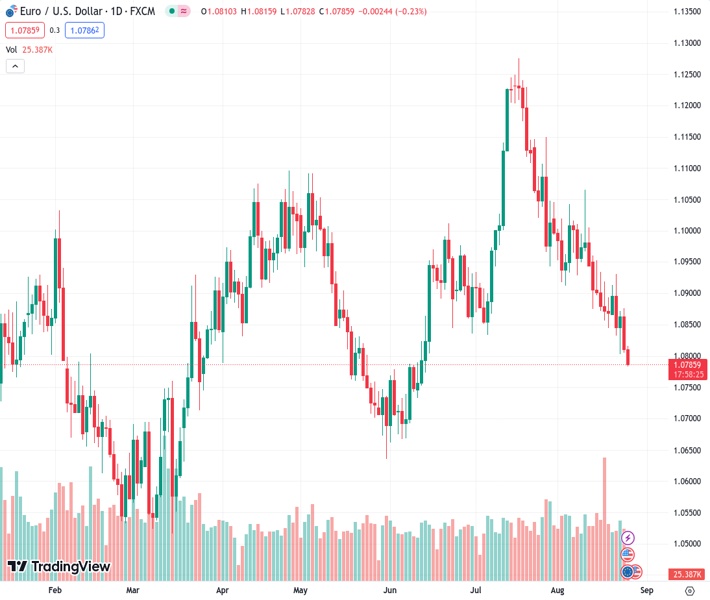
The EURUSD currency pair, currently trading at 1.07857, has reached its lowest point in the past two months and appears likely to record losses for the sixth consecutive week.
…
This is a premium post.
[s2If !current_user_can(access_s2member_level4)]Please register for FREE REGISTER to read full post below containing analysis. In case of any error or you think you are not able to read the full post below, please email us at support#nehcap.com [lwa][/s2If] [s2If current_user_can(access_s2member_level1)]
- EUR/USD drops to a two-month low and seems poised to register losses for the sixth straight week.
The pair currently trades last at 1.07857.
The previous day high was 1.0877 while the previous day low was 1.0805. The daily 38.2% Fib levels comes at 1.0832, expected to provide resistance. Similarly, the daily 61.8% fib level is at 1.0849, expected to provide resistance.
The EUR/USD pair remains under some selling pressure for the second successive day on Friday and drops to its lowest level since June 14 during the Asian session. Spot prices currently trade around the 1.0785-1.0780 region, down 0.25% for the day, and seem poised to end in the red for the sixth straight week.
The overnight hawkish remarks by Federal Reserve (Fed) officials keep the door open for one more 25 bps lift-off by the end of this year and lift the US Dollar (USD) to a more than two-month high. Apart from this, speculations that the European Central Bank (ECB) will halt its streak of nine consecutive rate hikes in September undermine the shared currency and contribute to the offered tone surrounding the EUR/USD pair.
From a technical perspective, the downward trajectory drags spot prices below the very important 200-day Simple Moving Average (SMA) for the first time since November 2022. This could be seen as a fresh trigger for bearish traders and supports prospects for an extension of the EUR/USD pair’s over a one-month-old descending trend from a nearly 17-month peak, around the 1.1275 area touched on July 18.
That said, the Relative Strength Index (RSI) is on the verge of breaking into oversold territory. This, in turn, warrants caution ahead of Fed Chair Jerome Powell’s speech on Friday and ECB President Christine Lagarde’s statement on Saturday, at the Jackson Hole Symposium. Nevertheless, the fundamental backdrop suggests that the path of least resistance for the EUR/USD pair is to the downside.
Furthermore, a convincing break and acceptance below a technically significant 200-day SMA add credence to the negative outlook. Hence, a subsequent fall towards the next relevant support near the 1.0750-1.0745 region, en route to the 1.0700 round-figure mark, looks like a distinct possibility. Some follow-through selling might then expose the May 2023 swing low, around the 1.0635 region.
On the flip side, any intraday recovery back above the 1.0800 round-figure mark might now be seen as a selling opportunity and remain capped near the 1.0840 region. This is followed by the 1.0870-1.0875 supply zone, which if cleared decisively might negate the bearish outlook. The EUR/USD pair might then aim to surpass the 1.0900 round-figure mark and test the 1.0915-1.0920 resistance zone.
Technical Levels: Supports and Resistances
EURUSD currently trading at 1.0786 at the time of writing. Pair opened at 1.081 and is trading with a change of -0.22 % .
| Overview | Overview.1 | |
|---|---|---|
| 0 | Today last price | 1.0786 |
| 1 | Today Daily Change | -0.0024 |
| 2 | Today Daily Change % | -0.2200 |
| 3 | Today daily open | 1.0810 |
The pair remains strongly bearish on the daily time frame. It trades below the 20 SMA @ 1.093, 50 SMA 1.098, 100 SMA @ 1.0929 and 200 SMA @ 1.0801.
| Trends | Trends.1 | |
|---|---|---|
| 0 | Daily SMA20 | 1.0930 |
| 1 | Daily SMA50 | 1.0980 |
| 2 | Daily SMA100 | 1.0929 |
| 3 | Daily SMA200 | 1.0801 |
The previous day high was 1.0877 while the previous day low was 1.0805. The daily 38.2% Fib levels comes at 1.0832, expected to provide resistance. Similarly, the daily 61.8% fib level is at 1.0849, expected to provide resistance.
Note the levels of interest below:
- Pivot support is noted at 1.0785, 1.0759, 1.0713
- Pivot resistance is noted at 1.0856, 1.0902, 1.0928
| Levels | Levels.1 |
|---|---|
| Previous Daily High | 1.0877 |
| Previous Daily Low | 1.0805 |
| Previous Weekly High | 1.0960 |
| Previous Weekly Low | 1.0845 |
| Previous Monthly High | 1.1276 |
| Previous Monthly Low | 1.0834 |
| Daily Fibonacci 38.2% | 1.0832 |
| Daily Fibonacci 61.8% | 1.0849 |
| Daily Pivot Point S1 | 1.0785 |
| Daily Pivot Point S2 | 1.0759 |
| Daily Pivot Point S3 | 1.0713 |
| Daily Pivot Point R1 | 1.0856 |
| Daily Pivot Point R2 | 1.0902 |
| Daily Pivot Point R3 | 1.0928 |
[/s2If]
Download Nehcap EAWe have two EAs that are operational on our LIVE accounts.
- EA-FIX: Check out the details here. Download EA-FIX . EA-FIX is a non-grid HFT scalper.
- EA-GROWTH: High quality low dd EA using trend grids. Download EA_GROWTHJoin Our Telegram Group
")


