EURJPY is finding it difficult to make significant progress and is moving in a tight range on Friday.
…
This is a premium post.
[s2If !current_user_can(access_s2member_level4)]Please register for FREE REGISTER to read full post below containing analysis. In case of any error or you think you are not able to read the full post below, please email us at support#nehcap.com [lwa][/s2If] [s2If current_user_can(access_s2member_level1)]
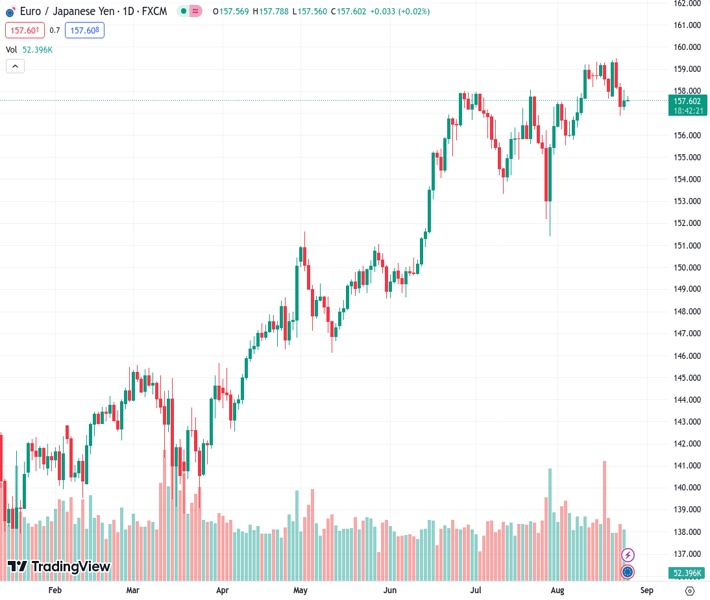
- EUR/JPY struggles to gain any meaningful traction and oscillates in a narrow band on Friday.
The pair currently trades last at 157.618.
The previous day high was 158.05 while the previous day low was 157.11. The daily 38.2% Fib levels comes at 157.69, expected to provide resistance. Similarly, the daily 61.8% fib level is at 157.47, expected to provide support.
The EUR/JPY cross attracts some buyers during the Asian session on Friday, albeit lacks follow-through and remains confined in the previous day’s broader range. Spot prices currently trade around the 157.65-157.70 region, nearly unchanged for the day, awaiting the European Central Bank (ECB) President Christine Lagarde’s speech at the Jackson Hole Symposium on Saturday.
Speculations have been mounting that the ECB will halt its streak of nine consecutive rate hikes in September, especially after the flash PMI prints showed that business activity in the Euro Zone declined more than expected in August. Hence, investors will closely scrutinise Lagarde’s remarks for fresh cues about the future rate-hike path, which will play a key role in influencing the shared currency and provide a fresh directional impetus to the EUR/JPY cross.
In the meantime, the downside seems cushioned in the wake of the prevalent selling bias around the Japanese Yen (JPY). Receding fears of an imminent intervention by authorities, along with a more dovish stance adopted by the Bank of Japan (BoJ), continue to undermine the JPY and should lend support to the EUR/JPY cross. In fact, the BoJ is the only central bank in the world to maintain negative rates and is widely expected to stick to its ultra-ease policy settings.
The bets were reaffirmed by data released on Friday, showing that consumer inflation in Tokyo – Japan’s capital city – grew at a slower-than-expected pace in August. In fact, the Statistics Bureau reported that the headline Tokyo CPI eased to the 2.9% YoY rate in August from 3.2% prior, though the core figure, which excludes fresh food and energy costs, remained at 4% – its highest level in over 40 years. The data, however, fails to provide any respite to the JPY bulls.
The aforementioned mixed fundamental backdrop, meanwhile, holds back traders from placing aggressive directional bets around the EUR/JPY cross and contributes to the subdued/range-bound price action on the last day of the week. Hence, it will be prudent to wait for strong follow-through selling before confirming that spot prices have topped out and positioning for an extension of this week’s retracement slide from the vicinity of mid-159.00s, or the highest level since September 2008.
Technical Levels: Supports and Resistances
EURJPY currently trading at 157.69 at the time of writing. Pair opened at 157.67 and is trading with a change of 0.01 % .
| Overview | Overview.1 | |
|---|---|---|
| 0 | Today last price | 157.69 |
| 1 | Today Daily Change | 0.02 |
| 2 | Today Daily Change % | 0.01 |
| 3 | Today daily open | 157.67 |
The pair is trading below its 20 Daily moving average @ 157.69, above its 50 Daily moving average @ 156.74 , above its 100 Daily moving average @ 152.71 and above its 200 Daily moving average @ 147.61
| Trends | Trends.1 | |
|---|---|---|
| 0 | Daily SMA20 | 157.69 |
| 1 | Daily SMA50 | 156.74 |
| 2 | Daily SMA100 | 152.71 |
| 3 | Daily SMA200 | 147.61 |
The previous day high was 158.05 while the previous day low was 157.11. The daily 38.2% Fib levels comes at 157.69, expected to provide resistance. Similarly, the daily 61.8% fib level is at 157.47, expected to provide support.
Note the levels of interest below:
- Pivot support is noted at 157.17, 156.67, 156.23
- Pivot resistance is noted at 158.11, 158.54, 159.04
| Levels | Levels.1 |
|---|---|
| Previous Daily High | 158.05 |
| Previous Daily Low | 157.11 |
| Previous Weekly High | 159.34 |
| Previous Weekly Low | 157.66 |
| Previous Monthly High | 158.05 |
| Previous Monthly Low | 151.41 |
| Daily Fibonacci 38.2% | 157.69 |
| Daily Fibonacci 61.8% | 157.47 |
| Daily Pivot Point S1 | 157.17 |
| Daily Pivot Point S2 | 156.67 |
| Daily Pivot Point S3 | 156.23 |
| Daily Pivot Point R1 | 158.11 |
| Daily Pivot Point R2 | 158.54 |
| Daily Pivot Point R3 | 159.04 |
[/s2If]
Download Nehcap EAWe have two EAs that are operational on our LIVE accounts.
- EA-FIX: Check out the details here. Download EA-FIX . EA-FIX is a non-grid HFT scalper.
- EA-GROWTH: High quality low dd EA using trend grids. Download EA_GROWTHJoin Our Telegram Group
")


