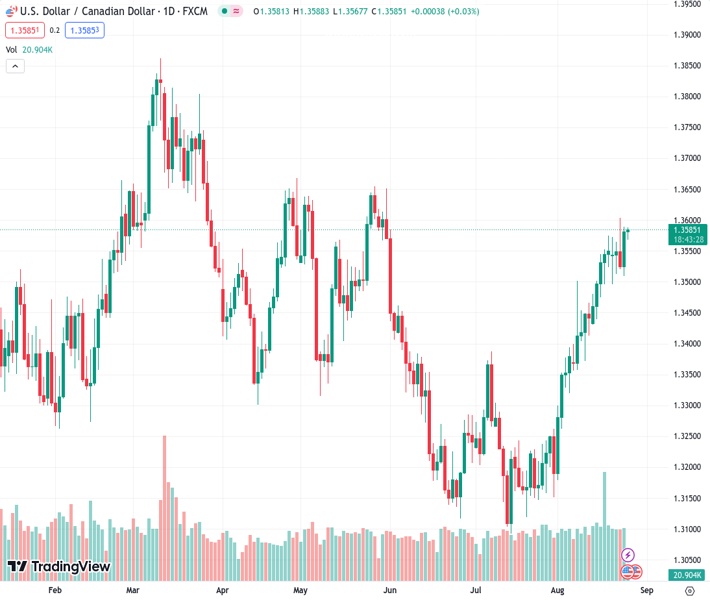
The USDCAD pair is trading with gains for the second day in a row, currently at a level of 1.35856.
…
This is a premium post.
[s2If !current_user_can(access_s2member_level4)]Please register for FREE REGISTER to read full post below containing analysis. In case of any error or you think you are not able to read the full post below, please email us at support#nehcap.com [lwa][/s2If] [s2If current_user_can(access_s2member_level1)]
- USD/CAD trades in positive territory for the second consecutive day.
The pair currently trades last at 1.35856.
The previous day high was 1.3589 while the previous day low was 1.351. The daily 38.2% Fib levels comes at 1.3559, expected to provide support. Similarly, the daily 61.8% fib level is at 1.354, expected to provide support.
The USD/CAD pair gains momentum below the 1.3600 barrier during the early Asian trading hours on Friday. The major pair currently trades around 1.3583, up 0.01% on the day. Meanwhile, The US Dollar Index (DXY) climbs above 104.00, the highest in 11 weeks. Market participants await the Federal Reserve (Fed) Chairman Jerome Powell’s speech for fresh impetus.
On Thursday, Philadelphia Federal Reserve (Fed) President Patrick Harker indicated at the Jackson Hole Symposium that the central bank has probably done enough with restrictive monetary policy. He also said that the Fed would keep interest rates steady this year, but that next year will be determined by data. While Boston Fed President Susan Collins said that more rate hikes are possible. However, providing a clear signal about the timing of the rate cut is premature. Hawkish comments from the Fed officials could boost the Greenback and act as a tailwind for USD/CAD.
About the data, US Durable Goods Orders MoM declined -5.2% in July, above expectations of -4% but falling short of the previous month’s gain of 4.4%. This is the greatest drop since April 2020. Meanwhile, the Chicago Fed National Activity Index increased to 0.12 in July from -0.33 prior, and the Kansas Fed Manufacturing Activity Index rose to 12.0 in August from -20.0 in the previous month.
On the Loonie front, Statistics Canada showed on Wednesday that monthly Canadian Retail Sales for June expanded by 0.1% from the previous month, better than the expectation of 0%. On a monthly basis, Retail Sales declined 0.8%, worse than the market consensus of an increase of 0.3%.
Following the publication of Canadian Retail Sales data, money markets lowered their expectations for a quarter-point rate rise in the Bank of Canada (BoC) September meeting. Investors priced in an 18% possibility once the data was released, compared to 27% prior. It’s worth noting that the BoC increased its interest rate by 25 basis points (bps) to 5%. In its July meeting. Meanwhile, a decline in oil prices weakens the Loonie as Canada is the largest exporter of crude to the US.
Moving on, Fed Chairman Jerome Powell’s Speech on Friday will be a closely watched event. The speech could provide insights into economic conditions and hints as to whether inflation is under control or whether additional interest rate hikes are required to combat inflation. Traders will take cues and find trading opportunities around the USD/CAD pair.
Technical Levels: Supports and Resistances
USDCAD currently trading at 1.3583 at the time of writing. Pair opened at 1.3582 and is trading with a change of 0.01 % .
| Overview | Overview.1 | |
|---|---|---|
| 0 | Today last price | 1.3583 |
| 1 | Today Daily Change | 0.0001 |
| 2 | Today Daily Change % | 0.0100 |
| 3 | Today daily open | 1.3582 |
The pair remains strongly bullish on the daily timeframe. It trades above its 20 SMA @ 1.3435, 50 SMA 1.3301, 100 SMA @ 1.3388 and 200 SMA @ 1.3458.
| Trends | Trends.1 | |
|---|---|---|
| 0 | Daily SMA20 | 1.3435 |
| 1 | Daily SMA50 | 1.3301 |
| 2 | Daily SMA100 | 1.3388 |
| 3 | Daily SMA200 | 1.3458 |
The previous day high was 1.3589 while the previous day low was 1.351. The daily 38.2% Fib levels comes at 1.3559, expected to provide support. Similarly, the daily 61.8% fib level is at 1.354, expected to provide support.
Note the levels of interest below:
- Pivot support is noted at 1.3532, 1.3481, 1.3452
- Pivot resistance is noted at 1.3611, 1.364, 1.369
| Levels | Levels.1 |
|---|---|
| Previous Daily High | 1.3589 |
| Previous Daily Low | 1.3510 |
| Previous Weekly High | 1.3575 |
| Previous Weekly Low | 1.3437 |
| Previous Monthly High | 1.3387 |
| Previous Monthly Low | 1.3093 |
| Daily Fibonacci 38.2% | 1.3559 |
| Daily Fibonacci 61.8% | 1.3540 |
| Daily Pivot Point S1 | 1.3532 |
| Daily Pivot Point S2 | 1.3481 |
| Daily Pivot Point S3 | 1.3452 |
| Daily Pivot Point R1 | 1.3611 |
| Daily Pivot Point R2 | 1.3640 |
| Daily Pivot Point R3 | 1.3690 |
[/s2If]
Download Nehcap EAWe have two EAs that are operational on our LIVE accounts.
- EA-FIX: Check out the details here. Download EA-FIX . EA-FIX is a non-grid HFT scalper.
- EA-GROWTH: High quality low dd EA using trend grids. Download EA_GROWTHJoin Our Telegram Group
")


