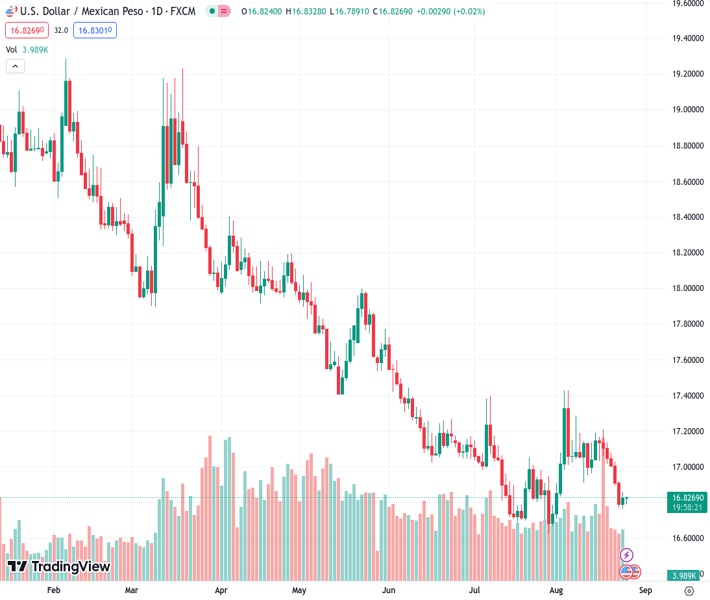
The USDMXN currency pair has moved up slightly from its recent low point of three weeks ago, currently sitting at a rate of 16.8267. According to analyst @nehcap, there is not anticipated to be a significant decrease in value in the near future.
…
This is a premium post.
[s2If !current_user_can(access_s2member_level4)]Please register for FREE REGISTER to read full post below containing analysis. In case of any error or you think you are not able to read the full post below, please email us at support#nehcap.com [lwa][/s2If] [s2If current_user_can(access_s2member_level1)]
- USD/MXN edges higher after bouncing off the lowest level in three weeks.
The pair currently trades last at 16.8267.
The previous day high was 16.859 while the previous day low was 16.7626. The daily 38.2% Fib levels comes at 16.8222, expected to provide support. Similarly, the daily 61.8% fib level is at 16.7995, expected to provide support.
USD/MXN defends the previous day’s rebound from the lowest level in three weeks while making rounds to 16.82–83 during the early hours of Friday’s Asian session.
In doing so, the Mexican Peso (MXN) pair bounces off the 16.80 support confluence comprising a 1.5-month-long horizontal support area, as well as the resistance-turned-support line stretched from late May.
It’s worth noting, however, that the bearish MACD signals and downbeat RSI (14) line challenge the USD/MXN pair’s latest rebound.
Also acting as the upside filter is the joint of the 21-DMA and 50-DMA, around the 17.00 threshold.
Additionally, the mid-August swing high of around 17.20 and the monthly peak of 17.43 can test the USD/MXN pair buyers past the 17.00 psychological magnet before giving them control.
On the flip side, a daily closing beneath the 16.80 support confluence could quickly fetch the Mexican Peso (MXN) pair towards the Year-To-Date low of around 16.62.
Above all, the USD/MXN rebound appears elusive ahead of the key central bankers’ speeches. Among them, Fed Chair Jerome Powell will gain major attention amid recently mixed US data and concerns about the policy pivot.
Also read:
Trend: Limited downside expected
Technical Levels: Supports and Resistances
USDMXN currently trading at 16.8311 at the time of writing. Pair opened at 16.834 and is trading with a change of -0.02% % .
| Overview | Overview.1 | |
|---|---|---|
| 0 | Today last price | 16.8311 |
| 1 | Today Daily Change | -0.0029 |
| 2 | Today Daily Change % | -0.02% |
| 3 | Today daily open | 16.834 |
The pair remains strongly bearish on the daily time frame. It trades below the 20 SMA @ 17.0092, 50 SMA 17.0048, 100 SMA @ 17.3785 and 200 SMA @ 18.1411.
| Trends | Trends.1 | |
|---|---|---|
| 0 | Daily SMA20 | 17.0092 |
| 1 | Daily SMA50 | 17.0048 |
| 2 | Daily SMA100 | 17.3785 |
| 3 | Daily SMA200 | 18.1411 |
The previous day high was 16.859 while the previous day low was 16.7626. The daily 38.2% Fib levels comes at 16.8222, expected to provide support. Similarly, the daily 61.8% fib level is at 16.7995, expected to provide support.
Note the levels of interest below:
- Pivot support is noted at 16.7781, 16.7222, 16.6817
- Pivot resistance is noted at 16.8745, 16.915, 16.9709
| Levels | Levels.1 |
|---|---|
| Previous Daily High | 16.8590 |
| Previous Daily Low | 16.7626 |
| Previous Weekly High | 17.2094 |
| Previous Weekly Low | 16.9663 |
| Previous Monthly High | 17.3957 |
| Previous Monthly Low | 16.6258 |
| Daily Fibonacci 38.2% | 16.8222 |
| Daily Fibonacci 61.8% | 16.7995 |
| Daily Pivot Point S1 | 16.7781 |
| Daily Pivot Point S2 | 16.7222 |
| Daily Pivot Point S3 | 16.6817 |
| Daily Pivot Point R1 | 16.8745 |
| Daily Pivot Point R2 | 16.9150 |
| Daily Pivot Point R3 | 16.9709 |
[/s2If]
Download Nehcap EAWe have two EAs that are operational on our LIVE accounts.
- EA-FIX: Check out the details here. Download EA-FIX . EA-FIX is a non-grid HFT scalper.
- EA-GROWTH: High quality low dd EA using trend grids. Download EA_GROWTHJoin Our Telegram Group
")


