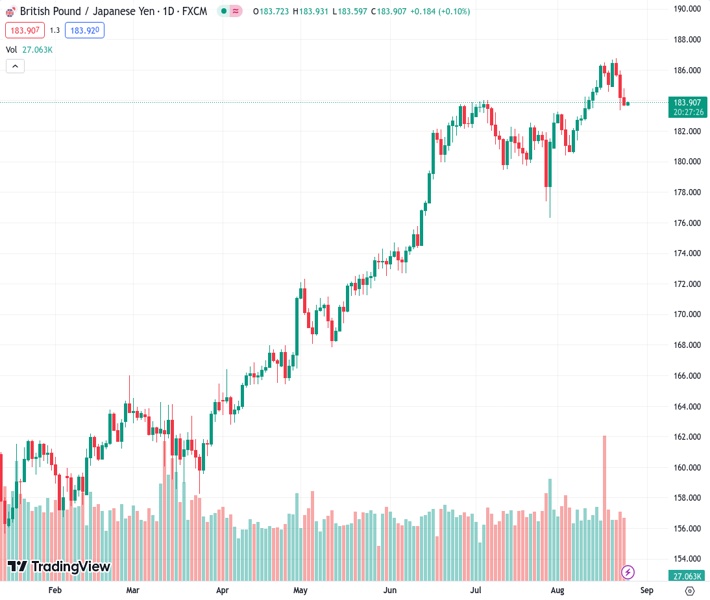
After the release of Tokyo Consumer Price Index (CPI) data, the GBPJPY pair is still holding its defensive position around 183.85.
…
This is a premium post.
[s2If !current_user_can(access_s2member_level4)]Please register for FREE REGISTER to read full post below containing analysis. In case of any error or you think you are not able to read the full post below, please email us at support#nehcap.com [lwa][/s2If] [s2If current_user_can(access_s2member_level1)]
- GBP/JPY remains in the defensive near 183.85 after Tokyo Consumer Price Index (CPI) data.
The pair currently trades last at 183.901.
The previous day high was 184.78 while the previous day low was 183.6. The daily 38.2% Fib levels comes at 184.05, expected to provide resistance. Similarly, the daily 61.8% fib level is at 184.33, expected to provide resistance.
The GBP/JPY cross posts modest gains but remains below the 184.00 barriers during the early Asian session on Friday. The cross currently trades around 183.85, gaining 0.07% on the day following the release of Japanese inflation data.
The Statistics Bureau of Japan reported on Friday that the Tokyo Consumer Price Index (CPI) for August, fell to 2.9% YoY from 3.2% in the previous month, against 3.0% market predictions, while the Tokyo CPI ex Fresh Food and Energy remained stable at 4.0% YoY.
From the technical perspective, the GBP/JPY cross stands below the 50- and 100-hour Exponential Moving Averages (EMAs) with a downward slope on the one-hour chart, which means the path of the least resistance is to the downside. It’s worth noting that the Relative Strength Index (RSI) is located in bearish territory below 50 highlighting that further downside cannot be ruled out.
The first resistance level of GBP/JPY is seen at 184.15, representing the midline of the Bollinger Band. The additional upside filter to watch is 184.45 (50-hour EMA). The key barrier for the cross is located at 184.80, a confluence of the upper boundary of the Bollinger Band and the 100-hour EMA. Any meaningful follow-through buying will see the next stop at 185.50 (low of August 22) and 186.00 (a psychological round mark, high of August 23).
On the downside, a decisive break below 183.55 (the lower limit of Bollinger Band) will see a drop to 183.30 (the low of August 10). The key contention is seen at 183.00, portraying a high of August 9 and a psychological figure. Further south, the cross will see a downside stop at 182.35 (low of August 9).
Technical Levels: Supports and Resistances
GBPJPY currently trading at 183.86 at the time of writing. Pair opened at 183.74 and is trading with a change of 0.07 % .
| Overview | Overview.1 | |
|---|---|---|
| 0 | Today last price | 183.86 |
| 1 | Today Daily Change | 0.12 |
| 2 | Today Daily Change % | 0.07 |
| 3 | Today daily open | 183.74 |
The pair remains strongly bullish on the daily timeframe. It trades above its 20 SMA @ 183.69, 50 SMA 182.62, 100 SMA @ 176.64 and 200 SMA @ 169.47.
| Trends | Trends.1 | |
|---|---|---|
| 0 | Daily SMA20 | 183.69 |
| 1 | Daily SMA50 | 182.62 |
| 2 | Daily SMA100 | 176.64 |
| 3 | Daily SMA200 | 169.47 |
The previous day high was 184.78 while the previous day low was 183.6. The daily 38.2% Fib levels comes at 184.05, expected to provide resistance. Similarly, the daily 61.8% fib level is at 184.33, expected to provide resistance.
Note the levels of interest below:
- Pivot support is noted at 183.3, 182.87, 182.13
- Pivot resistance is noted at 184.47, 185.21, 185.64
| Levels | Levels.1 |
|---|---|
| Previous Daily High | 184.78 |
| Previous Daily Low | 183.60 |
| Previous Weekly High | 186.47 |
| Previous Weekly Low | 183.46 |
| Previous Monthly High | 184.02 |
| Previous Monthly Low | 176.32 |
| Daily Fibonacci 38.2% | 184.05 |
| Daily Fibonacci 61.8% | 184.33 |
| Daily Pivot Point S1 | 183.30 |
| Daily Pivot Point S2 | 182.87 |
| Daily Pivot Point S3 | 182.13 |
| Daily Pivot Point R1 | 184.47 |
| Daily Pivot Point R2 | 185.21 |
| Daily Pivot Point R3 | 185.64 |
[/s2If]
Download Nehcap EAWe have two EAs that are operational on our LIVE accounts.
- EA-FIX: Check out the details here. Download EA-FIX . EA-FIX is a non-grid HFT scalper.
- EA-GROWTH: High quality low dd EA using trend grids. Download EA_GROWTHJoin Our Telegram Group
")


