The price of silver, symbolized by XAGUSD, remains low after falling from its highest point in three weeks. Nehcap anticipates that the price will continue to decline further.
…
This is a premium post.
[s2If !current_user_can(access_s2member_level4)]Please register for FREE REGISTER to read full post below containing analysis. In case of any error or you think you are not able to read the full post below, please email us at support#nehcap.com [lwa][/s2If] [s2If current_user_can(access_s2member_level1)]
- Silver Price stays depressed after reversing from three-week high.
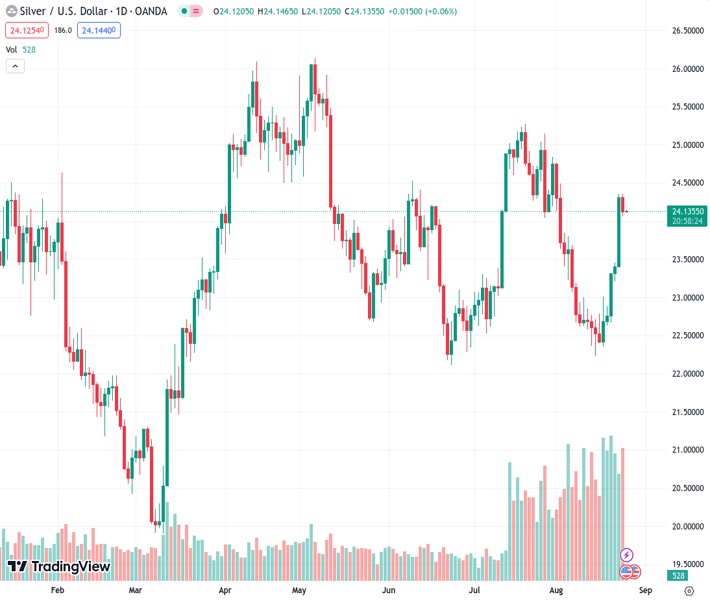
The pair currently trades last at 24.129.
The previous day high was 24.36 while the previous day low was 23.41. The daily 38.2% Fib levels comes at 24.0, expected to provide support. Similarly, the daily 61.8% fib level is at 23.77, expected to provide support.
Silver Price (XAG/USD) remains pressured around $24.15 amid the early hours of Friday’s Asian session after reversing from a three-week high the previous day. In doing so, the bright metal portrays the market’s cautious mood ahead of today’s top-tier central bankers’ speeches at the Jackson Hole Symposium, including Federal Reserve (Fed) Chairman Jerome Powell.
That said, the XAG/USD justified the overbought RSI (14) line and a looming bear cross on the MACD while reversing from a multi-day high on Thursday. However, the 38.2% Fibonacci retracement level of the commodity’s late June-July upside, near the $24.00 round figure, prods the sellers amid anxious markets.
Even if the quote breaks the immediate Fibonacci ratio, the 200-SMA level of around $23.80 can act as the final defense of the buyers.
Following that, a quick slump toward the 61.8% Fibonacci retracement surrounding $23.30, also known as the “Golden Ratio”, can’t be ruled out.
Meanwhile, the latest peak of around $24.35 can lure Silver buyers during the fresh recovery.
Even so, the 23.6% Fibonacci retracement and a downward-sloping resistance line from late July, respectively near $24.55 and $24.65, will challenge the XAG/USD bulls before giving them control.
Trend: Further downside expected
Technical Levels: Supports and Resistances
XAGUSD currently trading at 24.15 at the time of writing. Pair opened at 24.32 and is trading with a change of -0.70% % .
| Overview | Overview.1 | |
|---|---|---|
| 0 | Today last price | 24.15 |
| 1 | Today Daily Change | -0.17 |
| 2 | Today Daily Change % | -0.70% |
| 3 | Today daily open | 24.32 |
The pair remains strongly bullish on the daily timeframe. It trades above its 20 SMA @ 23.32, 50 SMA 23.52, 100 SMA @ 23.99 and 200 SMA @ 23.32.
| Trends | Trends.1 | |
|---|---|---|
| 0 | Daily SMA20 | 23.32 |
| 1 | Daily SMA50 | 23.52 |
| 2 | Daily SMA100 | 23.99 |
| 3 | Daily SMA200 | 23.32 |
The previous day high was 24.36 while the previous day low was 23.41. The daily 38.2% Fib levels comes at 24.0, expected to provide support. Similarly, the daily 61.8% fib level is at 23.77, expected to provide support.
Note the levels of interest below:
- Pivot support is noted at 23.7, 23.08, 22.75
- Pivot resistance is noted at 24.65, 24.98, 25.6
| Levels | Levels.1 |
|---|---|
| Previous Daily High | 24.36 |
| Previous Daily Low | 23.41 |
| Previous Weekly High | 23.01 |
| Previous Weekly Low | 22.23 |
| Previous Monthly High | 25.27 |
| Previous Monthly Low | 22.52 |
| Daily Fibonacci 38.2% | 24.00 |
| Daily Fibonacci 61.8% | 23.77 |
| Daily Pivot Point S1 | 23.70 |
| Daily Pivot Point S2 | 23.08 |
| Daily Pivot Point S3 | 22.75 |
| Daily Pivot Point R1 | 24.65 |
| Daily Pivot Point R2 | 24.98 |
| Daily Pivot Point R3 | 25.60 |
[/s2If]
Download Nehcap EAWe have two EAs that are operational on our LIVE accounts.
- EA-FIX: Check out the details here. Download EA-FIX . EA-FIX is a non-grid HFT scalper.
- EA-GROWTH: High quality low dd EA using trend grids. Download EA_GROWTHJoin Our Telegram Group
")


