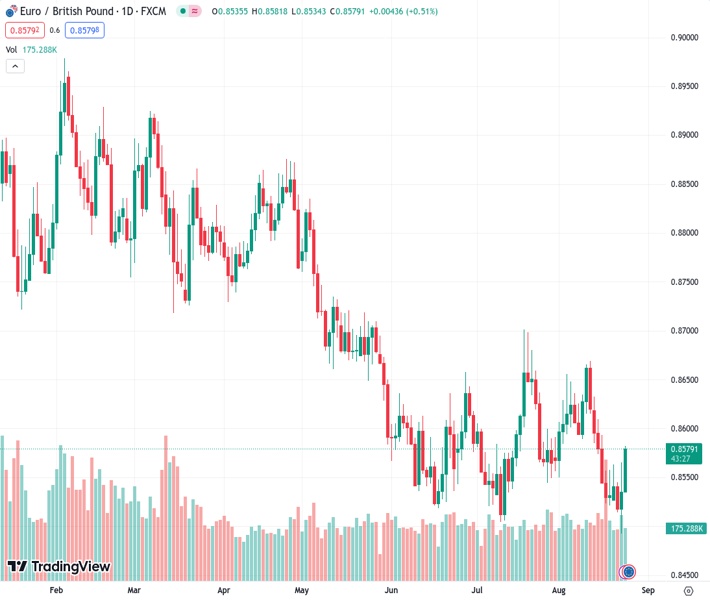
The EURGBP currency pair has reached a new high in the past six days around the level of 0.8580. This level coincides with the 50-day Simple Moving Average (SMA).
…
This is a premium post.
[s2If !current_user_can(access_s2member_level4)]Please register for FREE REGISTER to read full post below containing analysis. In case of any error or you think you are not able to read the full post below, please email us at support#nehcap.com [lwa][/s2If] [s2If current_user_can(access_s2member_level1)]
- EUR/GBP prints a new six-day high at around 0.8580, confluence with the 50-day SMA.
The pair currently trades last at 0.85796.
The previous day high was 0.8566 while the previous day low was 0.8493. The daily 38.2% Fib levels comes at 0.8538, expected to provide support. Similarly, the daily 61.8% fib level is at 0.8521, expected to provide support.
EUR/GBP resumes its uptrend and hits a six-day high, with buyers set to challenge higher prices after weaker economic data from the UK hurt the Pound Sterling (GBP) prospects. At the time of writing, the pair is exchanging hands at 0.8579, gains 0.52%.
From a daily chart perspective, the cross remains neutral to downward biased, but the latest economic data from the UK shifted flows and favored the Euro (EUR). Today’s price action witnessed the EUR/GBP printing a new six-day high at around 0.8580, which confluences with the 50-day Simple Moving Average (SMA). A break above would expose the 0.8600 figure, followed by the month-to-date (MTD) high of 0.8669.
Short term, the pair is set to close the week in an upbeat mode, as the pair would end Thursday’s session at weekly highs. If EUR/GBP decisively breaks 0.8600, key resistance levels emerge at the August 14 high at 0.8632, followed by the August 11 daily high at 0.8669. Next stop would be 0.8700. Conversely, if the cross drops below the 200-hour MA (HMA) at 0.8553, Thursday’s lows would be up for grabs at 0.8534, followed by the YTD low at 0.8492.
Technical Levels: Supports and Resistances
EURGBP currently trading at 0.8581 at the time of writing. Pair opened at 0.8537 and is trading with a change of 0.52 % .
| Overview | Overview.1 | |
|---|---|---|
| 0 | Today last price | 0.8581 |
| 1 | Today Daily Change | 0.0044 |
| 2 | Today Daily Change % | 0.5200 |
| 3 | Today daily open | 0.8537 |
The pair remains strongly bearish on the daily time frame. It trades below the 20 SMA @ 0.8584, 50 SMA 0.8582, 100 SMA @ 0.8651 and 200 SMA @ 0.8716.
| Trends | Trends.1 | |
|---|---|---|
| 0 | Daily SMA20 | 0.8584 |
| 1 | Daily SMA50 | 0.8582 |
| 2 | Daily SMA100 | 0.8651 |
| 3 | Daily SMA200 | 0.8716 |
The previous day high was 0.8566 while the previous day low was 0.8493. The daily 38.2% Fib levels comes at 0.8538, expected to provide support. Similarly, the daily 61.8% fib level is at 0.8521, expected to provide support.
Note the levels of interest below:
- Pivot support is noted at 0.8498, 0.8459, 0.8425
- Pivot resistance is noted at 0.8571, 0.8605, 0.8644
| Levels | Levels.1 |
|---|---|
| Previous Daily High | 0.8566 |
| Previous Daily Low | 0.8493 |
| Previous Weekly High | 0.8633 |
| Previous Weekly Low | 0.8524 |
| Previous Monthly High | 0.8701 |
| Previous Monthly Low | 0.8504 |
| Daily Fibonacci 38.2% | 0.8538 |
| Daily Fibonacci 61.8% | 0.8521 |
| Daily Pivot Point S1 | 0.8498 |
| Daily Pivot Point S2 | 0.8459 |
| Daily Pivot Point S3 | 0.8425 |
| Daily Pivot Point R1 | 0.8571 |
| Daily Pivot Point R2 | 0.8605 |
| Daily Pivot Point R3 | 0.8644 |
[/s2If]
Download Nehcap EAWe have two EAs that are operational on our LIVE accounts.
- EA-FIX: Check out the details here. Download EA-FIX . EA-FIX is a non-grid HFT scalper.
- EA-GROWTH: High quality low dd EA using trend grids. Download EA_GROWTHJoin Our Telegram Group
")


