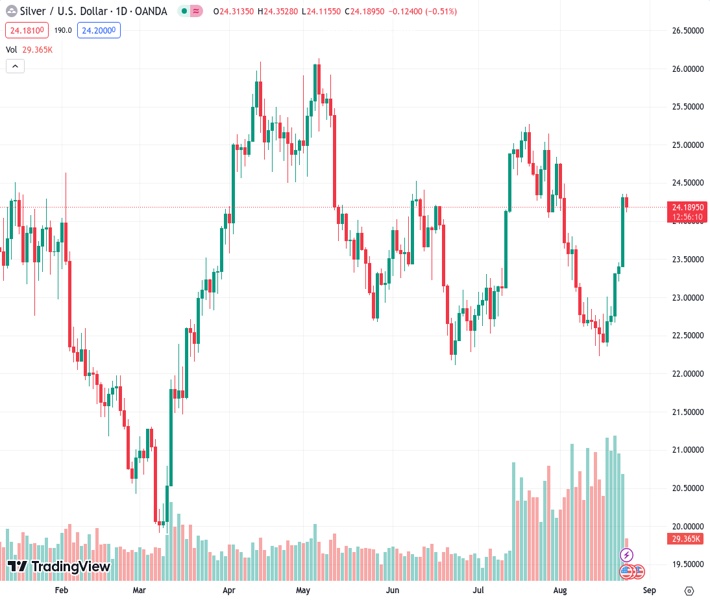
Silver, represented by #XAGUSD, experiences resistance from an increase in supply, causing it to lose some of its previous overnight gains and decline from its three-week high.
…
This is a premium post.
[s2If !current_user_can(access_s2member_level4)]Please register for FREE REGISTER to read full post below containing analysis. In case of any error or you think you are not able to read the full post below, please email us at support#nehcap.com [lwa][/s2If] [s2If current_user_can(access_s2member_level1)]
- Silver meets with some supply and erodes a part of the overnight gains to a three-week peak.
The pair currently trades last at 24.167.
The previous day high was 24.36 while the previous day low was 23.41. The daily 38.2% Fib levels comes at 24.0, expected to provide support. Similarly, the daily 61.8% fib level is at 23.77, expected to provide support.
Silver comes under some selling pressure on Thursday and for now, seems to have snapped a five-day winning streak to a three-week high, around the $24.35 region touched the previous day. The white metal extends intraday descent through the early European session and drops to a fresh daily low, around the $24.15 region in the last hour.
From a technical perspective, the extremely overbought Relative Strength Index (RSI) on hourly charts turns out to be a key factor that prompts some long-unwinding around the XAG/USD. That said, oscillators on the daily chart have just started gaining positive traction. Furthermore, the overnight breakout through the $23.75 confluence, comprising the 200-period Simple Moving Average (SMA) on the 4-hour chart and the 50% Fibonacci retracement level of the July-August downfall, favours bulls.
Hence, any subsequent slide below the $24.00 round-figure mark is more likely to attract fresh buyers near the aforementioned confluence breakpoint, now turned support. This should help limit the downside for the XAG/USD near the $23.40 region. This is closely followed by support near the $23.25 area, which if broken could drag the white metal back towards the $23.00 mark. A convincing break below the latter will negate the positive outlook and shift the near-term bias in favour of bearish traders.
On the flip side, bulls might now wait for some follow-through buying beyond the overnight swing high, around the $24.35 area, before placing fresh bets. The XAG/USD might then aim to surpass the $24.55-$24.60 intermediate hurdle and climb further to the $25.00 psychological mark en route to the July monthly swing high, around the $25.25 zone. Some follow-through buying will mark a fresh breakout and pave the way for a further near-term appreciating move toward the $26.00 round figure.
Technical Levels: Supports and Resistances
XAGUSD currently trading at 24.15 at the time of writing. Pair opened at 24.32 and is trading with a change of -0.7 % .
| Overview | Overview.1 | |
|---|---|---|
| 0 | Today last price | 24.15 |
| 1 | Today Daily Change | -0.17 |
| 2 | Today Daily Change % | -0.70 |
| 3 | Today daily open | 24.32 |
The pair remains strongly bullish on the daily timeframe. It trades above its 20 SMA @ 23.32, 50 SMA 23.52, 100 SMA @ 23.99 and 200 SMA @ 23.32.
| Trends | Trends.1 | |
|---|---|---|
| 0 | Daily SMA20 | 23.32 |
| 1 | Daily SMA50 | 23.52 |
| 2 | Daily SMA100 | 23.99 |
| 3 | Daily SMA200 | 23.32 |
The previous day high was 24.36 while the previous day low was 23.41. The daily 38.2% Fib levels comes at 24.0, expected to provide support. Similarly, the daily 61.8% fib level is at 23.77, expected to provide support.
Note the levels of interest below:
- Pivot support is noted at 23.7, 23.08, 22.75
- Pivot resistance is noted at 24.65, 24.98, 25.6
| Levels | Levels.1 |
|---|---|
| Previous Daily High | 24.36 |
| Previous Daily Low | 23.41 |
| Previous Weekly High | 23.01 |
| Previous Weekly Low | 22.23 |
| Previous Monthly High | 25.27 |
| Previous Monthly Low | 22.52 |
| Daily Fibonacci 38.2% | 24.00 |
| Daily Fibonacci 61.8% | 23.77 |
| Daily Pivot Point S1 | 23.70 |
| Daily Pivot Point S2 | 23.08 |
| Daily Pivot Point S3 | 22.75 |
| Daily Pivot Point R1 | 24.65 |
| Daily Pivot Point R2 | 24.98 |
| Daily Pivot Point R3 | 25.60 |
[/s2If]
Download Nehcap EAWe have two EAs that are operational on our LIVE accounts.
- EA-FIX: Check out the details here. Download EA-FIX . EA-FIX is a non-grid HFT scalper.
- EA-GROWTH: High quality low dd EA using trend grids. Download EA_GROWTHJoin Our Telegram Group
")


