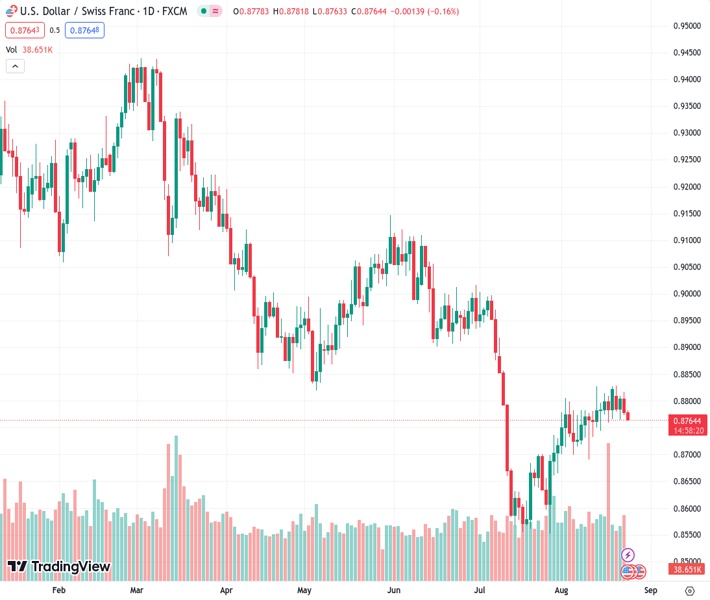
The USDCHF pair is experiencing downward pressure at its weekly low of 0.87656 and is continuing to retreat from its 50-day moving average and a significant resistance level. According to the viewpoint of Nehcap, there is not much expectation for further decline.
…
This is a premium post.
[s2If !current_user_can(access_s2member_level4)]Please register for FREE REGISTER to read full post below containing analysis. In case of any error or you think you are not able to read the full post below, please email us at support#nehcap.com [lwa][/s2If] [s2If current_user_can(access_s2member_level1)]
- USD/CHF remains pressured at weekly low, extends pullback from 50-DMA, key resistance line.
The pair currently trades last at 0.87656.
The previous day high was 0.8817 while the previous day low was 0.8774. The daily 38.2% Fib levels comes at 0.8791, expected to provide resistance. Similarly, the daily 61.8% fib level is at 0.8801, expected to provide resistance.
USD/CHF drops to the lowest level in a week while refreshing intraday bottom around 0.8765 heading into Thursday’s European session. In doing so, the Swiss Franc (CHF) pair prints a two-day losing streak by extending the previous day’s reversal from the 50-DMA and a three-month-old descending resistance line.
Not only the failure to cross the key DMA and trend line resistance but a sustained trading beneath the previous support line, which broke on Monday, joins the impending bear cross on the MACD indicator to also keep the USD/CHF sellers hopeful.
With this, the Swiss Franc (CHF) pair sellers approach a one-month-old horizontal support zone surrounding the 0.8700 threshold.
Following that, the 0.8635-30 region will act as the final defense of the USD/CHF buyers before pushing the traders toward the multi-year low marked in July around 0.8552.
Meanwhile, a convergence of the stated DMA and trend line, around 0.8805, restricts the immediate upside of the USD/CHF pair, a break of which could propel the quote towards the previous support line surrounding 0.8825.
However, the quote’s upside past 0.8825 needs validation from the double tops surrounding 0.8830.
Overall, the USD/CHF remains bearish but the room toward the south appears limited.
Trend: Limited downside expected
Technical Levels: Supports and Resistances
USDCHF currently trading at 0.8765 at the time of writing. Pair opened at 0.8781 and is trading with a change of -0.18% % .
| Overview | Overview.1 | |
|---|---|---|
| 0 | Today last price | 0.8765 |
| 1 | Today Daily Change | -0.0016 |
| 2 | Today Daily Change % | -0.18% |
| 3 | Today daily open | 0.8781 |
The pair is trading above its 20 Daily moving average @ 0.8762, below its 50 Daily moving average @ 0.8801 , below its 100 Daily moving average @ 0.8894 and below its 200 Daily moving average @ 0.909
| Trends | Trends.1 | |
|---|---|---|
| 0 | Daily SMA20 | 0.8762 |
| 1 | Daily SMA50 | 0.8801 |
| 2 | Daily SMA100 | 0.8894 |
| 3 | Daily SMA200 | 0.9090 |
The previous day high was 0.8817 while the previous day low was 0.8774. The daily 38.2% Fib levels comes at 0.8791, expected to provide resistance. Similarly, the daily 61.8% fib level is at 0.8801, expected to provide resistance.
Note the levels of interest below:
- Pivot support is noted at 0.8764, 0.8747, 0.8721
- Pivot resistance is noted at 0.8807, 0.8834, 0.8851
| Levels | Levels.1 |
|---|---|
| Previous Daily High | 0.8817 |
| Previous Daily Low | 0.8774 |
| Previous Weekly High | 0.8828 |
| Previous Weekly Low | 0.8738 |
| Previous Monthly High | 0.9005 |
| Previous Monthly Low | 0.8552 |
| Daily Fibonacci 38.2% | 0.8791 |
| Daily Fibonacci 61.8% | 0.8801 |
| Daily Pivot Point S1 | 0.8764 |
| Daily Pivot Point S2 | 0.8747 |
| Daily Pivot Point S3 | 0.8721 |
| Daily Pivot Point R1 | 0.8807 |
| Daily Pivot Point R2 | 0.8834 |
| Daily Pivot Point R3 | 0.8851 |
[/s2If]
Download Nehcap EAWe have two EAs that are operational on our LIVE accounts.
- EA-FIX: Check out the details here. Download EA-FIX . EA-FIX is a non-grid HFT scalper.
- EA-GROWTH: High quality low dd EA using trend grids. Download EA_GROWTHJoin Our Telegram Group
")


