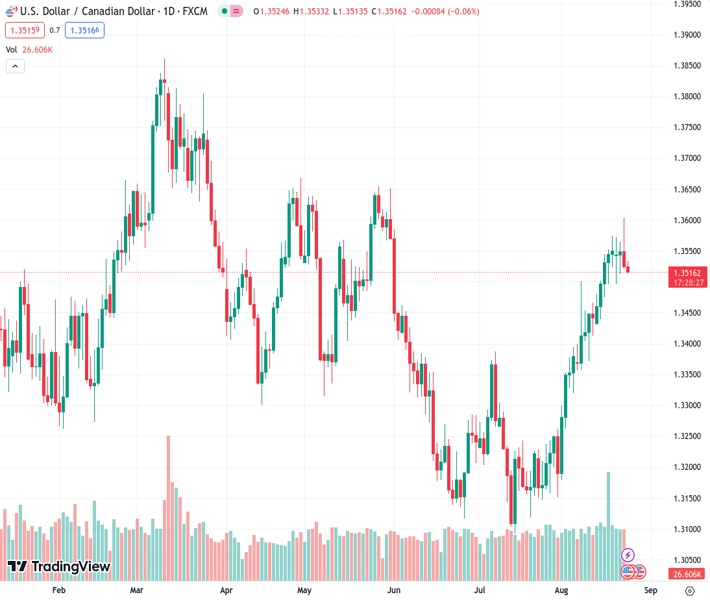
After falling from its three-month high, the USDCAD at 1.35145 seems to be lacking any significant forward movement.
…
This is a premium post.
[s2If !current_user_can(access_s2member_level4)]Please register for FREE REGISTER to read full post below containing analysis. In case of any error or you think you are not able to read the full post below, please email us at support#nehcap.com [lwa][/s2If] [s2If current_user_can(access_s2member_level1)]
- USD/CAD lacks momentum after reversing from three-month high.
The pair currently trades last at 1.35145.
The previous day high was 1.3604 while the previous day low was 1.352. The daily 38.2% Fib levels comes at 1.3552, expected to provide resistance. Similarly, the daily 61.8% fib level is at 1.3572, expected to provide resistance.
USD/CAD bears struggle to keep the reins after returning to the table the previous day, following the Loonie pair’s U-turn from a three-month high. That said, the quote remains indecisive around 1.3520 amid early Thursday morning in Europe.
In doing so, the Loonie pair portrays the market’s cautious mood ahead of a slew of US data and the start of a two-day-long annual Jackson Hole Symposium. Furthermore, dicey Oil prices and the US Dollar’s lackluster moves also challenged the USD/CAD traders of late.
US Dollar Index (DXY) remains sidelined around 103.40 after reversing from an 11-week high the previous day whereas the WTI crude oil, Canada’s main export item, prints mild losses around $78.40 while fading the bounce off a one-month low marked on Wednesday.
It should be noted that a heavy draw of Oil inventories, per the weekly stockpile data from the US Energy Information Administration (EIA), contrasts with the market’s fears of lesser energy demand due to the latest downbeat PMIs to trouble the traders of Oil and USD/CAD.
On the same line, the US statistics came in mostly weak but the Canadian data weren’t impressive, which in turn spoils the market’s outlook about the USD/CAD pair, despite recently easing fears of higher rates that called bears the previous day.
On Wednesday, preliminary readings of the US S&P Global Manufacturing PMI dropped to 47.0 for August from 49.0 versus 49.3 market forecasts whereas the Services counterpart also edged lower to 51.0, compared to 52.2 expected and 52.3 marked the previous month. With this, the S&P Global Composite PMI for the US eased to 50.4 for the said month from 52.0 prior and the analysts’ estimations. Further, US New Home Sales change rose to 4.4% MoM for July versus -2.5% previous readings.
At home, Canada’s Retail Sales for June reprinted 0.1% MoM revised growth versus the market consensus of 0.0% while the Retail Sales ex Autos slumped to -0.8% from -0.3% prior figures (revised) and 0.3% market forecasts.
While portraying the market’s mood, S&P500 Futures rose half a percent to 4,470 by the press time, after rising the most in a month the previous day. Also, the US 10-year Treasury bond yields seesaw around 4.20%, pausing a two-day losing streak from the highest level since 2007, following the biggest daily slump in three weeks.
Moving ahead, the US Durable Goods Orders, Chicago Fed National Activity Index, Kansas Fed Manufacturing Activity and weekly Jobless Claims are the key data on the watch. Above all, Fed Chairman Jerome Powell’s defense of the hawkish monetary policy will be crucial to watch for clear directions as the latest US data suggest the nearness to the end of the rate hike cycle, which if confirmed could weigh on the US Dollar and favor the Loonie pair sellers.
A daily closing below a three-week-old rising support line, now immediate resistance around 1.3545, keeps the USD/CAD sellers hopeful.
Technical Levels: Supports and Resistances
USDCAD currently trading at 1.3521 at the time of writing. Pair opened at 1.3526 and is trading with a change of -0.04% % .
| Overview | Overview.1 | |
|---|---|---|
| 0 | Today last price | 1.3521 |
| 1 | Today Daily Change | -0.0005 |
| 2 | Today Daily Change % | -0.04% |
| 3 | Today daily open | 1.3526 |
The pair remains strongly bullish on the daily timeframe. It trades above its 20 SMA @ 1.3417, 50 SMA 1.3294, 100 SMA @ 1.3388 and 200 SMA @ 1.3457.
| Trends | Trends.1 | |
|---|---|---|
| 0 | Daily SMA20 | 1.3417 |
| 1 | Daily SMA50 | 1.3294 |
| 2 | Daily SMA100 | 1.3388 |
| 3 | Daily SMA200 | 1.3457 |
The previous day high was 1.3604 while the previous day low was 1.352. The daily 38.2% Fib levels comes at 1.3552, expected to provide resistance. Similarly, the daily 61.8% fib level is at 1.3572, expected to provide resistance.
Note the levels of interest below:
- Pivot support is noted at 1.3496, 1.3466, 1.3412
- Pivot resistance is noted at 1.358, 1.3634, 1.3663
| Levels | Levels.1 |
|---|---|
| Previous Daily High | 1.3604 |
| Previous Daily Low | 1.3520 |
| Previous Weekly High | 1.3575 |
| Previous Weekly Low | 1.3437 |
| Previous Monthly High | 1.3387 |
| Previous Monthly Low | 1.3093 |
| Daily Fibonacci 38.2% | 1.3552 |
| Daily Fibonacci 61.8% | 1.3572 |
| Daily Pivot Point S1 | 1.3496 |
| Daily Pivot Point S2 | 1.3466 |
| Daily Pivot Point S3 | 1.3412 |
| Daily Pivot Point R1 | 1.3580 |
| Daily Pivot Point R2 | 1.3634 |
| Daily Pivot Point R3 | 1.3663 |
[/s2If]
Download Nehcap EAWe have two EAs that are operational on our LIVE accounts.
- EA-FIX: Check out the details here. Download EA-FIX . EA-FIX is a non-grid HFT scalper.
- EA-GROWTH: High quality low dd EA using trend grids. Download EA_GROWTHJoin Our Telegram Group
")


