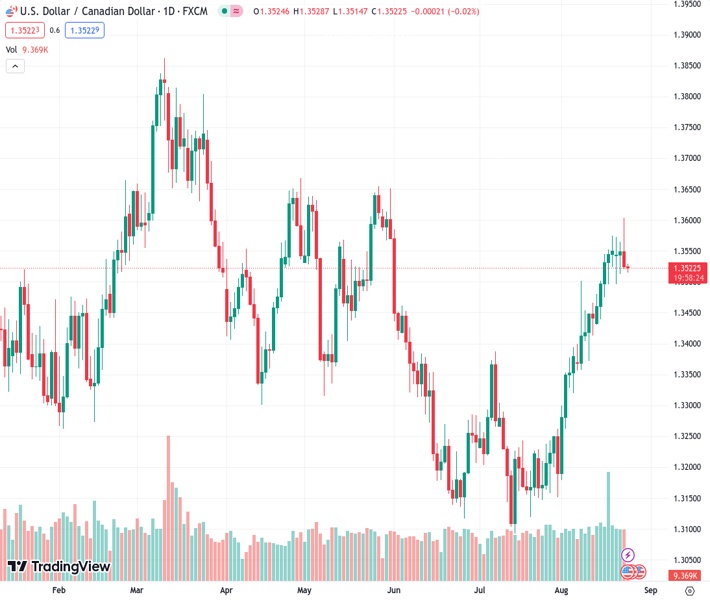
The currency pair USDCAD, currently valued at 1.35225, experiences small fluctuations within a limited range and is impacted by a mixture of conflicting factors.
…
This is a premium post.
[s2If !current_user_can(access_s2member_level4)]Please register for FREE REGISTER to read full post below containing analysis. In case of any error or you think you are not able to read the full post below, please email us at support#nehcap.com [lwa][/s2If] [s2If current_user_can(access_s2member_level1)]
- USD/CAD oscillates in a narrow band and is influenced by a combination of diverging forces.
The pair currently trades last at 1.35225.
The previous day high was 1.3604 while the previous day low was 1.352. The daily 38.2% Fib levels comes at 1.3552, expected to provide resistance. Similarly, the daily 61.8% fib level is at 1.3572, expected to provide resistance.
The USD/CAD pair struggles to gain any meaningful traction on Thursday, albeit manages to hold above the 1.3500 psychological mark during the Asian session. The mixed fundamental backdrop, meanwhile, warrants caution before positioning for an extension of the previous day’s rejection slide from the 1.3600 mark, or the highest level since May 31.
The US Dollar (USD) continues to be weighed down by the disappointing release of the flash US PMI prints on Wednesday, which showed that business activity approached the stagnation point in August. In fact, the S&P Global’s Composite US PMI fell to 50.4 in August from the 52 previous, registering the biggest drop since November 2022. This, along with a further decline in the US Treasury bond yields, is seen exerting some pressure on the Greenback and the USD/CAD pair.
The pullback in the USD Index (DXY), which tracks the Greenback against a basket of currencies, from over a two-month high, meanwhile, seems limited ahead of a speech by Federal Reserve Chair Jerome Powell at the Jackson Hole Symposium. Investors will closely scrutinise Powell’s comments for fresh cues about the Fed’s future rate-hike path, which will play a key role in driving the USD demand in the near term and provide a fresh directional impetus to the USD/CAD pair.
In the meantime, the weaker-than-expected Canadian Retail Sales figures released the previous day, along with softer Crude Oil prices, could undermine the commodity-linked Loonie and lend some support to spot prices. In fact, Oil prices languish near a one-month low amid concerns that a deeper global economic downturn will dent fuel demand. The fears resurfaced a host of manufacturing surveys painted a grim picture of the health of economies across the globe.
Hence, a strong follow-through selling is needed to confirm that the recent move-up witnessed since the beginning of this month has run its course and the USD/CAD pair has topped out near the 1.3600 mark. Market participants now look to the US economic docket, featuring the usual Weekly Initial Jobless Claims and Durable Goods Orders data. This, along with speeches by influential FOMC members, will influence the USD and provide some impetus to the USD/CAD pair.
Technical Levels: Supports and Resistances
USDCAD currently trading at 1.3522 at the time of writing. Pair opened at 1.3526 and is trading with a change of -0.03 % .
| Overview | Overview.1 | |
|---|---|---|
| 0 | Today last price | 1.3522 |
| 1 | Today Daily Change | -0.0004 |
| 2 | Today Daily Change % | -0.0300 |
| 3 | Today daily open | 1.3526 |
The pair remains strongly bullish on the daily timeframe. It trades above its 20 SMA @ 1.3417, 50 SMA 1.3294, 100 SMA @ 1.3388 and 200 SMA @ 1.3457.
| Trends | Trends.1 | |
|---|---|---|
| 0 | Daily SMA20 | 1.3417 |
| 1 | Daily SMA50 | 1.3294 |
| 2 | Daily SMA100 | 1.3388 |
| 3 | Daily SMA200 | 1.3457 |
The previous day high was 1.3604 while the previous day low was 1.352. The daily 38.2% Fib levels comes at 1.3552, expected to provide resistance. Similarly, the daily 61.8% fib level is at 1.3572, expected to provide resistance.
Note the levels of interest below:
- Pivot support is noted at 1.3496, 1.3466, 1.3412
- Pivot resistance is noted at 1.358, 1.3634, 1.3663
| Levels | Levels.1 |
|---|---|
| Previous Daily High | 1.3604 |
| Previous Daily Low | 1.3520 |
| Previous Weekly High | 1.3575 |
| Previous Weekly Low | 1.3437 |
| Previous Monthly High | 1.3387 |
| Previous Monthly Low | 1.3093 |
| Daily Fibonacci 38.2% | 1.3552 |
| Daily Fibonacci 61.8% | 1.3572 |
| Daily Pivot Point S1 | 1.3496 |
| Daily Pivot Point S2 | 1.3466 |
| Daily Pivot Point S3 | 1.3412 |
| Daily Pivot Point R1 | 1.3580 |
| Daily Pivot Point R2 | 1.3634 |
| Daily Pivot Point R3 | 1.3663 |
[/s2If]
Download Nehcap EAWe have two EAs that are operational on our LIVE accounts.
- EA-FIX: Check out the details here. Download EA-FIX . EA-FIX is a non-grid HFT scalper.
- EA-GROWTH: High quality low dd EA using trend grids. Download EA_GROWTHJoin Our Telegram Group
")


