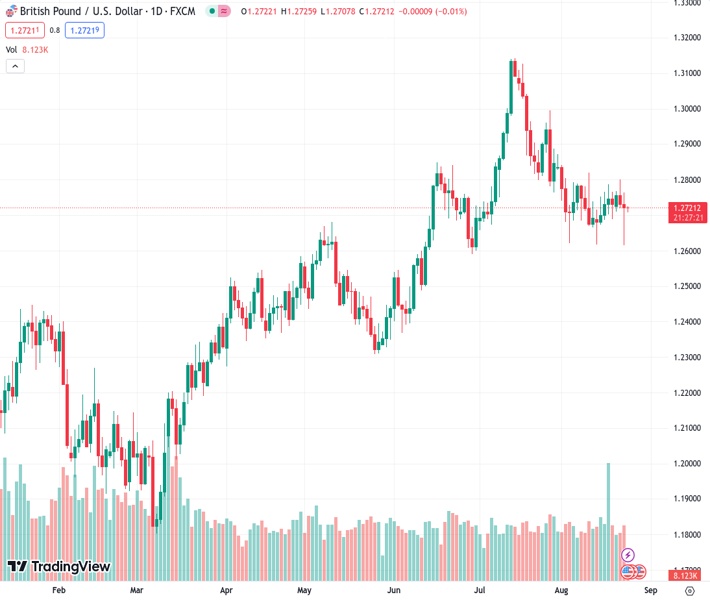
The GBPUSD currency pair at a rate of 1.27181 is experiencing a decrease in its rebound from a low point reached two months ago as a result of a careful sentiment. According to @nehcap, a withdrawal or decline is anticipated.
…
This is a premium post.
[s2If !current_user_can(access_s2member_level4)]Please register for FREE REGISTER to read full post below containing analysis. In case of any error or you think you are not able to read the full post below, please email us at support#nehcap.com [lwa][/s2If] [s2If current_user_can(access_s2member_level1)]
- GBP/USD fades recovery from two-month low amid cautious mood.
The pair currently trades last at 1.27181.
The previous day high was 1.28 while the previous day low was 1.2718. The daily 38.2% Fib levels comes at 1.275, expected to provide resistance. Similarly, the daily 61.8% fib level is at 1.2769, expected to provide resistance.
GBP/USD stays defensive around 1.2715-20 during the early hours of Thursday’s Asian session, fading the previous day’s rebound from the lowest level in eight weeks amid the market’s anxiety ahead of the top-tier data/events.
The Cable pair bounced off the 100-DMA and once again provided a daily close beyond an ascending support line from March 15, which in turn lures the Cable Sterling buyers as the US Dollar and Treasury bond yields drop. However, the cautious mood ahead of the top-tier US data and the start of the two-day-long annual Jackson Hole Symposium joins a slew of technical resistances to challenge the pair’s immediate upside.
That said, steady RSI (14) line and sluggish MACD signals also fail to inspire the GBP/USD buyers.
Among the key upside hurdles, the 50-DMA level of around 1.2800 and the support-turned-resistance line from early March, close to 1.2895 at the latest, appear major challenges for the Cable buyers. On the same line is June’s peak of around 1.2850.
It should be noted that a clear upside break of 1.2895 will need validation from the 1.2900 to convince the Pound Sterling buyers to aim for the 1.3000 threshold and the YTD peak of 1.3142.
On the flip side, the previously mentioned support line from March 15 and the 100-DMA, near 1.2685 and 1.2640 in that order, restrict the immediate downside of the GBP/USD pair. Additionally, May’s high of 1.2680 also acts as a downside filter.
Overall, GBP/USD remains on the bear’s radar unless it crosses the 1.2900 round figure.
Trend: Pullback expected
Technical Levels: Supports and Resistances
GBPUSD currently trading at 1.272 at the time of writing. Pair opened at 1.2732 and is trading with a change of -0.09% % .
| Overview | Overview.1 | |
|---|---|---|
| 0 | Today last price | 1.272 |
| 1 | Today Daily Change | -0.0012 |
| 2 | Today Daily Change % | -0.09% |
| 3 | Today daily open | 1.2732 |
The pair is trading below its 20 Daily moving average @ 1.2754, below its 50 Daily moving average @ 1.2795 , above its 100 Daily moving average @ 1.2634 and above its 200 Daily moving average @ 1.2388
| Trends | Trends.1 | |
|---|---|---|
| 0 | Daily SMA20 | 1.2754 |
| 1 | Daily SMA50 | 1.2795 |
| 2 | Daily SMA100 | 1.2634 |
| 3 | Daily SMA200 | 1.2388 |
The previous day high was 1.28 while the previous day low was 1.2718. The daily 38.2% Fib levels comes at 1.275, expected to provide resistance. Similarly, the daily 61.8% fib level is at 1.2769, expected to provide resistance.
Note the levels of interest below:
- Pivot support is noted at 1.27, 1.2668, 1.2618
- Pivot resistance is noted at 1.2782, 1.2832, 1.2864
| Levels | Levels.1 |
|---|---|
| Previous Daily High | 1.2800 |
| Previous Daily Low | 1.2718 |
| Previous Weekly High | 1.2788 |
| Previous Weekly Low | 1.2617 |
| Previous Monthly High | 1.3142 |
| Previous Monthly Low | 1.2659 |
| Daily Fibonacci 38.2% | 1.2750 |
| Daily Fibonacci 61.8% | 1.2769 |
| Daily Pivot Point S1 | 1.2700 |
| Daily Pivot Point S2 | 1.2668 |
| Daily Pivot Point S3 | 1.2618 |
| Daily Pivot Point R1 | 1.2782 |
| Daily Pivot Point R2 | 1.2832 |
| Daily Pivot Point R3 | 1.2864 |
[/s2If]
Download Nehcap EAWe have two EAs that are operational on our LIVE accounts.
- EA-FIX: Check out the details here. Download EA-FIX . EA-FIX is a non-grid HFT scalper.
- EA-GROWTH: High quality low dd EA using trend grids. Download EA_GROWTHJoin Our Telegram Group
")


