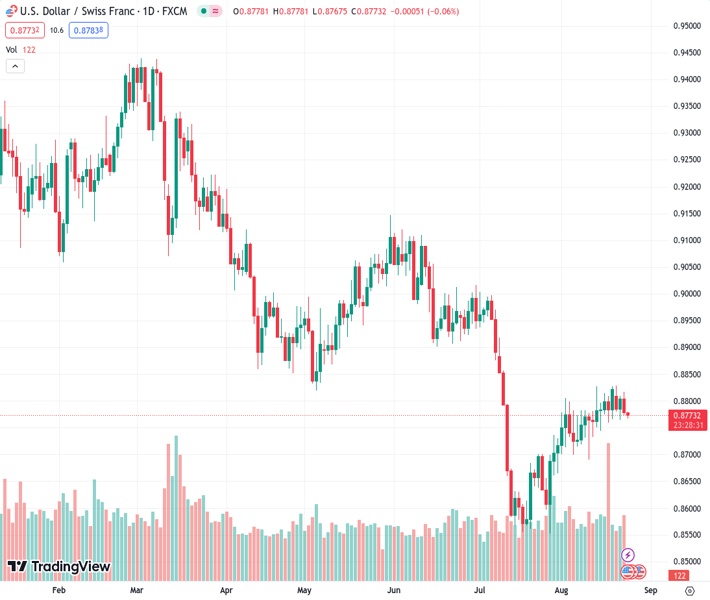
The currency pair USD/CHF has been trading within a narrow range of 0.8765 to 0.8830 for the past eight days and is currently positioned close to the middle point of the 0.8700 to 0.8800 range.
…
This is a premium post.
[s2If !current_user_can(access_s2member_level4)]Please register for FREE REGISTER to read full post below containing analysis. In case of any error or you think you are not able to read the full post below, please email us at support#nehcap.com [lwa][/s2If] [s2If current_user_can(access_s2member_level1)]
- USD/CHF trades in a tight 0.8765 to 0.8830 range for eight days, currently sitting near the mid-point of the 0.8700/0.8800 range.
The pair currently trades last at 0.87743.
The previous day high was 0.8809 while the previous day low was 0.8765. The daily 38.2% Fib levels comes at 0.8793, expected to provide resistance. Similarly, the daily 61.8% fib level is at 0.8782, expected to provide resistance.
USD/CHF has been trading within a narrow range of 0.8765 to 0.8830 for the past eight days, following a break of the 0.8600 figure. At the time of writing, the USD/CHF is trading beneath the 50-DMA, at around the mid-point of the 0.8700/0.8800 range, as the Asian session begins.
After breaching the 0.8800 figure, the USD/CHF remains subdued, unable to break above or below the 0.8765/0.8830 range for the last eight days. It should be said the major oscillates around the 50-day Moving Average (DMA) at 0.8798, trading on both sides of the DMA, while investors remain undecided to take a clear direction.
From an intraday point of view, the USD/CHF one-hour chart portrays the pair as neutral to downward biased, as it was set to finish Wednesday’s session near the lows of the day/week. Hence, the USD/CHF next support would be the current week’s low of 0.8764, followed by the S2 daily pivot at 0.8746. A decisive break would expose the August 11 daily low of 0.8767.
On the flip side, the USD/CHF first resistance would be the confluence of the daily pivot point and the 200-hour Moving Average (HMA) at 0.8789/90. If the pair clears that level, the pair’s next stop would be the R1 pivot point at 0.8806, followed by the August 23 high at 0.8817.
Technical Levels: Supports and Resistances
USDCHF currently trading at 0.8778 at the time of writing. Pair opened at 0.8804 and is trading with a change of -0.3 % .
| Overview | Overview.1 | |
|---|---|---|
| 0 | Today last price | 0.8778 |
| 1 | Today Daily Change | -0.0026 |
| 2 | Today Daily Change % | -0.3000 |
| 3 | Today daily open | 0.8804 |
The pair is trading above its 20 Daily moving average @ 0.8754, below its 50 Daily moving average @ 0.8805 , below its 100 Daily moving average @ 0.8897 and below its 200 Daily moving average @ 0.9094
| Trends | Trends.1 | |
|---|---|---|
| 0 | Daily SMA20 | 0.8754 |
| 1 | Daily SMA50 | 0.8805 |
| 2 | Daily SMA100 | 0.8897 |
| 3 | Daily SMA200 | 0.9094 |
The previous day high was 0.8809 while the previous day low was 0.8765. The daily 38.2% Fib levels comes at 0.8793, expected to provide resistance. Similarly, the daily 61.8% fib level is at 0.8782, expected to provide resistance.
Note the levels of interest below:
- Pivot support is noted at 0.8777, 0.8749, 0.8733
- Pivot resistance is noted at 0.8821, 0.8837, 0.8865
| Levels | Levels.1 |
|---|---|
| Previous Daily High | 0.8809 |
| Previous Daily Low | 0.8765 |
| Previous Weekly High | 0.8828 |
| Previous Weekly Low | 0.8738 |
| Previous Monthly High | 0.9005 |
| Previous Monthly Low | 0.8552 |
| Daily Fibonacci 38.2% | 0.8793 |
| Daily Fibonacci 61.8% | 0.8782 |
| Daily Pivot Point S1 | 0.8777 |
| Daily Pivot Point S2 | 0.8749 |
| Daily Pivot Point S3 | 0.8733 |
| Daily Pivot Point R1 | 0.8821 |
| Daily Pivot Point R2 | 0.8837 |
| Daily Pivot Point R3 | 0.8865 |
[/s2If]
Download Nehcap EAWe have two EAs that are operational on our LIVE accounts.
- EA-FIX: Check out the details here. Download EA-FIX . EA-FIX is a non-grid HFT scalper.
- EA-GROWTH: High quality low dd EA using trend grids. Download EA_GROWTHJoin Our Telegram Group
")


