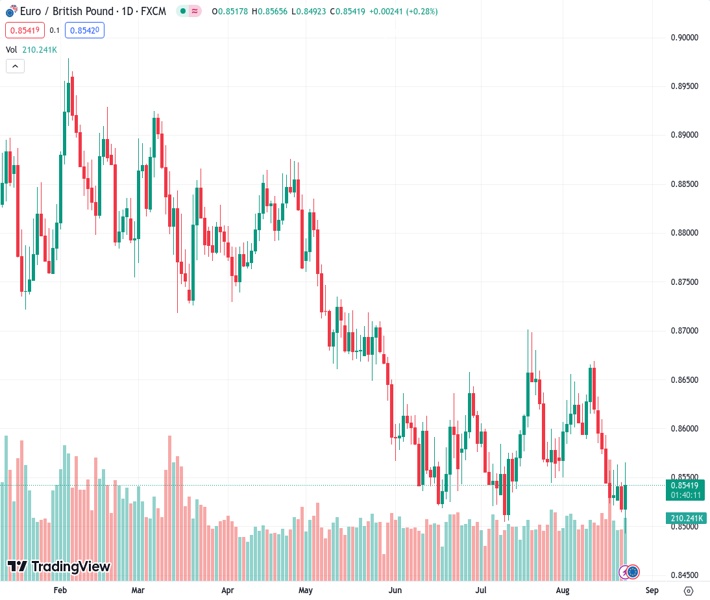
The Euro to British Pound exchange rate, with a value of 0.85416, has bounced back from its lowest point this year, which was 0.8492. Currently, it is trading at 0.8542, representing a gain of 0.28%. However, it remains below important moving averages.
…
This is a premium post.
[s2If !current_user_can(access_s2member_level4)]Please register for FREE REGISTER to read full post below containing analysis. In case of any error or you think you are not able to read the full post below, please email us at support#nehcap.com [lwa][/s2If] [s2If current_user_can(access_s2member_level1)]
- EUR/GBP rebounds from a YTD low of 0.8492 to trade at 0.8542, gaining 0.28%, but remains below crucial moving averages.
The pair currently trades last at 0.85416.
The previous day high was 0.8546 while the previous day low was 0.8514. The daily 38.2% Fib levels comes at 0.8526, expected to provide support. Similarly, the daily 61.8% fib level is at 0.8533, expected to provide support.
EUR/GBP currency pair is showing a neutral to downward bias as it hovers below both the 50 and 200-day Moving Averages (DMAs), according to the daily chart. Despite hitting a new year-to-date low of 0.8492, the pair saw buyers step in to reclaim the 0.8500 level, sparking a modest recovery towards the current exchange rate at around 0.8542, for a gain of 0.28%.
The EUR/GBP daily chart portrays the pair as neutral to downward biased, with the EUR/GBP standing below the 50 and 200-day Moving Averages (DMAs). It should be noted the EUR/GBP printed a new year-to-date (YTD) low of 0.8492, but buyers moved in and reclaimed the 0.8500 figure, spurring a recovery toward the 0.8540 area.
From an intraday perspective, the EUR/GBP hourly chart is neutral-biased, but it could turn upwards if the EUR/GBP achieves a daily close above the August 22 daily high of 0.8545. Once done, the EUR/GBP could test the 200-hour Moving Average (HMA) at 0.8561, followed by the current week’s high of 0.8565. A breach of the latter and the EUR/GBP could test the 0.8600.
Otherwise, if EUR/GBP registers a daily close below 0.8545, sellers could eye a test of the 0.8500 mark. Further downside is expected below that level.
Technical Levels: Supports and Resistances
EURGBP currently trading at 0.8539 at the time of writing. Pair opened at 0.8518 and is trading with a change of 0.25 % .
| Overview | Overview.1 | |
|---|---|---|
| 0 | Today last price | 0.8539 |
| 1 | Today Daily Change | 0.0021 |
| 2 | Today Daily Change % | 0.2500 |
| 3 | Today daily open | 0.8518 |
The pair remains strongly bearish on the daily time frame. It trades below the 20 SMA @ 0.8586, 50 SMA 0.8583, 100 SMA @ 0.8653 and 200 SMA @ 0.8717.
| Trends | Trends.1 | |
|---|---|---|
| 0 | Daily SMA20 | 0.8586 |
| 1 | Daily SMA50 | 0.8583 |
| 2 | Daily SMA100 | 0.8653 |
| 3 | Daily SMA200 | 0.8717 |
The previous day high was 0.8546 while the previous day low was 0.8514. The daily 38.2% Fib levels comes at 0.8526, expected to provide support. Similarly, the daily 61.8% fib level is at 0.8533, expected to provide support.
Note the levels of interest below:
- Pivot support is noted at 0.8506, 0.8494, 0.8474
- Pivot resistance is noted at 0.8538, 0.8558, 0.857
| Levels | Levels.1 |
|---|---|
| Previous Daily High | 0.8546 |
| Previous Daily Low | 0.8514 |
| Previous Weekly High | 0.8633 |
| Previous Weekly Low | 0.8524 |
| Previous Monthly High | 0.8701 |
| Previous Monthly Low | 0.8504 |
| Daily Fibonacci 38.2% | 0.8526 |
| Daily Fibonacci 61.8% | 0.8533 |
| Daily Pivot Point S1 | 0.8506 |
| Daily Pivot Point S2 | 0.8494 |
| Daily Pivot Point S3 | 0.8474 |
| Daily Pivot Point R1 | 0.8538 |
| Daily Pivot Point R2 | 0.8558 |
| Daily Pivot Point R3 | 0.8570 |
[/s2If]
Download Nehcap EAWe have two EAs that are operational on our LIVE accounts.
- EA-FIX: Check out the details here. Download EA-FIX . EA-FIX is a non-grid HFT scalper.
- EA-GROWTH: High quality low dd EA using trend grids. Download EA_GROWTHJoin Our Telegram Group
")


