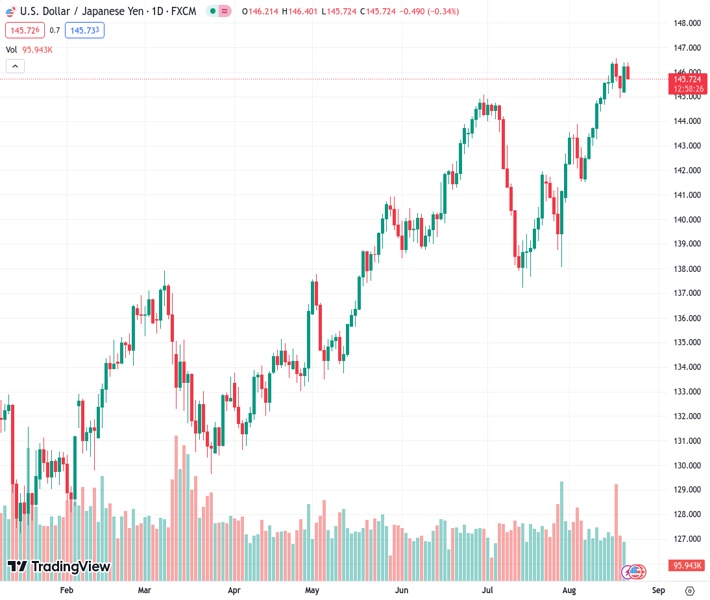
The USDJPY currency pair is currently moving horizontally near the 145.80 level in response to the fluctuations in JGB yields.
…
This is a premium post.
[s2If !current_user_can(access_s2member_level4)]Please register for FREE REGISTER to read full post below containing analysis. In case of any error or you think you are not able to read the full post below, please email us at support#nehcap.com [lwa][/s2If] [s2If current_user_can(access_s2member_level1)]
- USD/JPY trades sideways around 145.80 on JGB yields.
The pair currently trades last at 145.791.
The previous day high was 146.4 while the previous day low was 145.15. The daily 38.2% Fib levels comes at 145.92, expected to provide resistance. Similarly, the daily 61.8% fib level is at 145.63, expected to provide support.
USD/JPY trades lower around 145.80 during the early trading hours of the European session on Monday, consolidating after Japanese Government Bond (JGB) yields reached the highest level since 2014. Investors are cautious about the hawkish Bank of Japan (BoJ) monetary policy. The 146.00 psychological level could act as the minor resistance, following the area around the monthly high at 146.56.
The Moving Average Convergence Divergence (MACD) line suggests bullish sentiment of USD/JPY buyers as it stays in the positive territory of the centerline and shows divergence above the signal line. The 14-day Relative Strength Index (RSI) remains above 50, which confirms a bullish bias in the pair.
On the downside, the USD/JPY pair could face immediate support around the nine-day Exponential Moving Average (EMA) at 145.35. A firm break below that level could help the sellers to navigate the region around the 14-day Simple Moving Average (SMA) at 144.60, followed by the 23.6% Fibonacci retracement at 144.36.
Technical Levels: Supports and Resistances
USDJPY currently trading at 145.82 at the time of writing. Pair opened at 146.22 and is trading with a change of -0.27 % .
| Overview | Overview.1 | |
|---|---|---|
| 0 | Today last price | 145.82 |
| 1 | Today Daily Change | -0.40 |
| 2 | Today Daily Change % | -0.27 |
| 3 | Today daily open | 146.22 |
The pair remains strongly bullish on the daily timeframe. It trades above its 20 SMA @ 143.47, 50 SMA 142.45, 100 SMA @ 139.32 and 200 SMA @ 136.56.
| Trends | Trends.1 | |
|---|---|---|
| 0 | Daily SMA20 | 143.47 |
| 1 | Daily SMA50 | 142.45 |
| 2 | Daily SMA100 | 139.32 |
| 3 | Daily SMA200 | 136.56 |
The previous day high was 146.4 while the previous day low was 145.15. The daily 38.2% Fib levels comes at 145.92, expected to provide resistance. Similarly, the daily 61.8% fib level is at 145.63, expected to provide support.
Note the levels of interest below:
- Pivot support is noted at 145.44, 144.67, 144.19
- Pivot resistance is noted at 146.7, 147.18, 147.96
| Levels | Levels.1 |
|---|---|
| Previous Daily High | 146.40 |
| Previous Daily Low | 145.15 |
| Previous Weekly High | 146.56 |
| Previous Weekly Low | 144.65 |
| Previous Monthly High | 144.91 |
| Previous Monthly Low | 137.24 |
| Daily Fibonacci 38.2% | 145.92 |
| Daily Fibonacci 61.8% | 145.63 |
| Daily Pivot Point S1 | 145.44 |
| Daily Pivot Point S2 | 144.67 |
| Daily Pivot Point S3 | 144.19 |
| Daily Pivot Point R1 | 146.70 |
| Daily Pivot Point R2 | 147.18 |
| Daily Pivot Point R3 | 147.96 |
[/s2If]
Download Nehcap EAWe have two EAs that are operational on our LIVE accounts.
- EA-FIX: Check out the details here. Download EA-FIX . EA-FIX is a non-grid HFT scalper.
- EA-GROWTH: High quality low dd EA using trend grids. Download EA_GROWTHJoin Our Telegram Group
")


