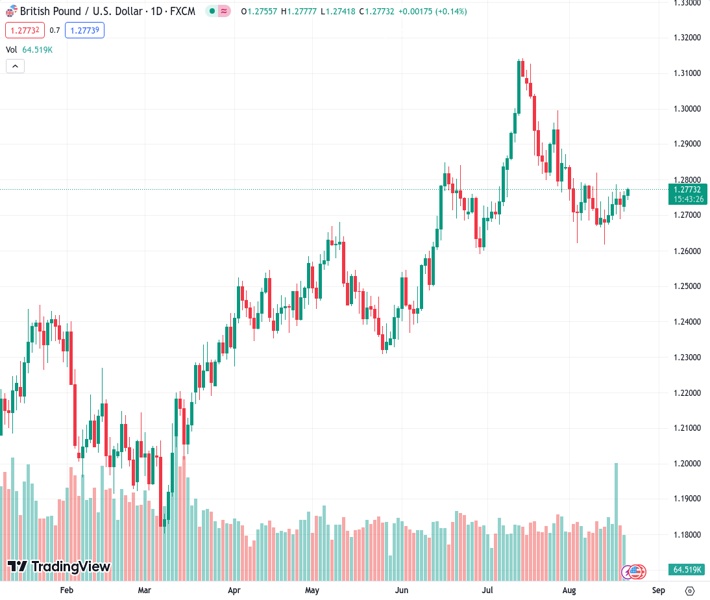
The currency pair GBPUSD is trading at approximately 1.27733 and has experienced a small increase in value, rising 0.11% throughout the day to reach around 1.2770.
…
This is a premium post.
[s2If !current_user_can(access_s2member_level4)]Please register for FREE REGISTER to read full post below containing analysis. In case of any error or you think you are not able to read the full post below, please email us at support#nehcap.com [lwa][/s2If] [s2If current_user_can(access_s2member_level1)]
- GBP/USD pair posts a modest gain near 1.2770, up 0.11% on the day.
The pair currently trades last at 1.27733.
The previous day high was 1.2767 while the previous day low was 1.271. The daily 38.2% Fib levels comes at 1.2745, expected to provide support. Similarly, the daily 61.8% fib level is at 1.2732, expected to provide support.
The GBP/USD pair gains momentum around 1.2770 heading into the European session on Tuesday. The pair trades in positive territory for the second day in a row amid the weakening of the Greenback. Meanwhile, the US Dollar Index (DXY), a measure of the value of USD against six other major currencies, drops to 103.22.
From the technical perspective, GBP/USD holds above the 50- and 100-hour Exponential Moving Averages (EMA) on the one-hour chart, which means further upside looks favorable. Meanwhile, the Relative Strength Index (RSI) stands above 50, within bullish territory, suggesting that buyers are likely to retain control in the near term.
Therefore, the major pair will meet the immediate resistance level of 1.2780-1.2785 region, representing the upper boundary of the Bollinger Band and a high of August 17. The additional upside filter is located at a psychological round figure of 1.2800. Further north, the next barrier is seen at 1.2840 (high of August 1) en route to 1.2888 (high of July 28).
On the flip side, any extended weakness below 1.2740 (100-hour EMA) will challenge the next contention at 1.2730 (the lower limit of the Bollinger Band). The key contention is located at 1.2700 (low of August 18 and a psychological figure).
Technical Levels: Supports and Resistances
GBPUSD currently trading at 1.277 at the time of writing. Pair opened at 1.2756 and is trading with a change of 0.11 % .
| Overview | Overview.1 | |
|---|---|---|
| 0 | Today last price | 1.2770 |
| 1 | Today Daily Change | 0.0014 |
| 2 | Today Daily Change % | 0.1100 |
| 3 | Today daily open | 1.2756 |
The pair is trading above its 20 Daily moving average @ 1.2763, below its 50 Daily moving average @ 1.2793 , above its 100 Daily moving average @ 1.2632 and above its 200 Daily moving average @ 1.2384
| Trends | Trends.1 | |
|---|---|---|
| 0 | Daily SMA20 | 1.2763 |
| 1 | Daily SMA50 | 1.2793 |
| 2 | Daily SMA100 | 1.2632 |
| 3 | Daily SMA200 | 1.2384 |
The previous day high was 1.2767 while the previous day low was 1.271. The daily 38.2% Fib levels comes at 1.2745, expected to provide support. Similarly, the daily 61.8% fib level is at 1.2732, expected to provide support.
Note the levels of interest below:
- Pivot support is noted at 1.2722, 1.2688, 1.2666
- Pivot resistance is noted at 1.2778, 1.2801, 1.2835
| Levels | Levels.1 |
|---|---|
| Previous Daily High | 1.2767 |
| Previous Daily Low | 1.2710 |
| Previous Weekly High | 1.2788 |
| Previous Weekly Low | 1.2617 |
| Previous Monthly High | 1.3142 |
| Previous Monthly Low | 1.2659 |
| Daily Fibonacci 38.2% | 1.2745 |
| Daily Fibonacci 61.8% | 1.2732 |
| Daily Pivot Point S1 | 1.2722 |
| Daily Pivot Point S2 | 1.2688 |
| Daily Pivot Point S3 | 1.2666 |
| Daily Pivot Point R1 | 1.2778 |
| Daily Pivot Point R2 | 1.2801 |
| Daily Pivot Point R3 | 1.2835 |
[/s2If]
Download Nehcap EAWe have two EAs that are operational on our LIVE accounts.
- EA-FIX: Check out the details here. Download EA-FIX . EA-FIX is a non-grid HFT scalper.
- EA-GROWTH: High quality low dd EA using trend grids. Download EA_GROWTHJoin Our Telegram Group
")


