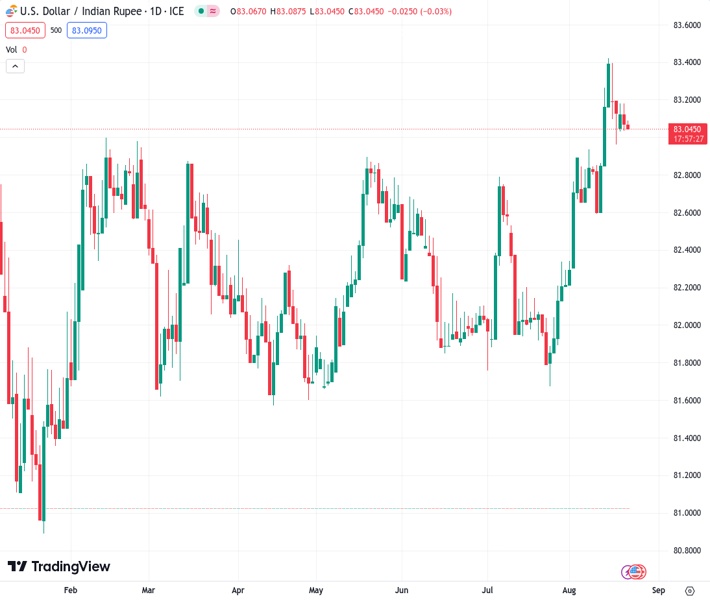
On Tuesday, the USDINR currency pair is expected to remain in a tight trading range above the 83.00 level.
…
This is a premium post.
[s2If !current_user_can(access_s2member_level4)]Please register for FREE REGISTER to read full post below containing analysis. In case of any error or you think you are not able to read the full post below, please email us at support#nehcap.com [lwa][/s2If] [s2If current_user_can(access_s2member_level1)]
- USD/INR is seen consolidating in a narrow trading band above the 83.00 mark on Tuesday.
The pair currently trades last at 83.0650.
The previous day high was 83.21 while the previous day low was 83.0246. The daily 38.2% Fib levels comes at 83.0954, expected to provide resistance. Similarly, the daily 61.8% fib level is at 83.1392, expected to provide resistance.
The USD/INR pair edges lower during the Asian session Tuesday and currently trades near the daily low, around the 83.00 mark, down less than 0.10% for the day. Spot prices, meanwhile, remain well within the striking distance of the all-time high touched last Tuesday and seem poised to prolong the recent upward trajectory witnessed over the past three weeks or so.
The US Dollar (USD) remains on the defensive for the second successive day and turns out to be a key factor acting as a headwind for the USD/INR pair. That said, growing acceptance that the Federal Reserve (Fed) will keep interest rates higher for longer helps the USD Index (DXY), which tracks the Greenback against a basket of currencies, to hold above a technically significant 200-day Simple Moving Average (SMA). This, along with a generally weaker risk tone, should limit any meaningful corrective decline for the safe-haven buck, from its highest level since July 12, and lend support to the pair ahead of the Jackson Hole Symposium later this week.
Even from a technical perspective, the recent breakout through the 83.00 strong barrier, which has been capping the upside for the USD/INR pair since November 2022, favours bullish traders. This, along with the fact that oscillators on the daily chart are holding comfortably in the positive territory, suggests that the path of least resistance for spot prices is to the upside. Hence, any further slide is likely to attract fresh buyers near the 82.80-82.75 area. This is followed by the 82.60-82.55 support, which should now act as a strong base. A convincing break below, however, might prompt some technical selling and pave the way for some meaningful downfall.
Bulls, meanwhile, might now wait for some follow-through buying beyond the 83.40 area, or the record high before positioning for a further near-term appreciating move towards the 84.00 round-figure mark.
Technical Levels: Supports and Resistances
USDINR currently trading at 83.0654 at the time of writing. Pair opened at 83.1305 and is trading with a change of -0.08 % .
| Overview | Overview.1 | |
|---|---|---|
| 0 | Today last price | 83.0654 |
| 1 | Today Daily Change | -0.0651 |
| 2 | Today Daily Change % | -0.0800 |
| 3 | Today daily open | 83.1305 |
The pair remains strongly bullish on the daily timeframe. It trades above its 20 SMA @ 82.7636, 50 SMA 82.3729, 100 SMA @ 82.2849 and 200 SMA @ 82.2364.
| Trends | Trends.1 | |
|---|---|---|
| 0 | Daily SMA20 | 82.7636 |
| 1 | Daily SMA50 | 82.3729 |
| 2 | Daily SMA100 | 82.2849 |
| 3 | Daily SMA200 | 82.2364 |
The previous day high was 83.21 while the previous day low was 83.0246. The daily 38.2% Fib levels comes at 83.0954, expected to provide resistance. Similarly, the daily 61.8% fib level is at 83.1392, expected to provide resistance.
Note the levels of interest below:
- Pivot support is noted at 83.0333, 82.9362, 82.8478
- Pivot resistance is noted at 83.2188, 83.3072, 83.4043
| Levels | Levels.1 |
|---|---|
| Previous Daily High | 83.2100 |
| Previous Daily Low | 83.0246 |
| Previous Weekly High | 83.5505 |
| Previous Weekly Low | 82.8946 |
| Previous Monthly High | 82.8334 |
| Previous Monthly Low | 81.6588 |
| Daily Fibonacci 38.2% | 83.0954 |
| Daily Fibonacci 61.8% | 83.1392 |
| Daily Pivot Point S1 | 83.0333 |
| Daily Pivot Point S2 | 82.9362 |
| Daily Pivot Point S3 | 82.8478 |
| Daily Pivot Point R1 | 83.2188 |
| Daily Pivot Point R2 | 83.3072 |
| Daily Pivot Point R3 | 83.4043 |
[/s2If]
Download Nehcap EAWe have two EAs that are operational on our LIVE accounts.
- EA-FIX: Check out the details here. Download EA-FIX . EA-FIX is a non-grid HFT scalper.
- EA-GROWTH: High quality low dd EA using trend grids. Download EA_GROWTHJoin Our Telegram Group
")


