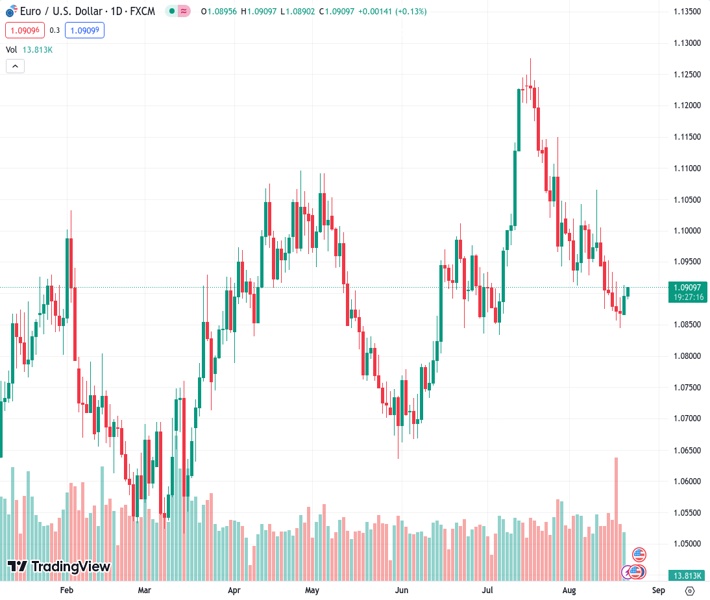
The EUR/USD pair remains cautious at a level of 1.09074, as the buyers find it difficult to support the idea of a bullish chart pattern formed a month ago. However, according to the viewpoint of Nehcap, there is anticipation for more upward movement.
…
This is a premium post.
[s2If !current_user_can(access_s2member_level4)]Please register for FREE REGISTER to read full post below containing analysis. In case of any error or you think you are not able to read the full post below, please email us at support#nehcap.com [lwa][/s2If] [s2If current_user_can(access_s2member_level1)]
- EUR/USD stays defensive as bulls struggle to justify a one-month-old falling wedge bullish chart formation.
The pair currently trades last at 1.09074.
The previous day high was 1.0914 while the previous day low was 1.0867. The daily 38.2% Fib levels comes at 1.0896, expected to provide support. Similarly, the daily 61.8% fib level is at 1.0885, expected to provide support.
EUR/USD buyers flirt with the 1.0900 threshold within a one-month-long falling wedge bullish chart formation on early Tuesday.
The Euro pair’s latest moves could be linked to the market’s cautious mood ahead of this week’s top-tier data/events, as well as the recent fears emanating from the US banking sector. The same weighs on the US Dollar Index (DXY) even as the Treasury bond yields refresh a multi-year high.
Also read: US Dollar Index: DXY retreats towards 103.00 despite strong yields, focus on mid-tier US data, central bankers
That said, the upbeat RSI (14) line and the bullish MACD signals keep the EUR/USD buyers hopeful of confirming the falling wedge chart pattern suggesting a theoretical target of 1.1340.
However, successful trading beyond the stated wedge’s top line, around 1.0910 by the press time, becomes necessary for the bullish confirmation.
Even so, the 200-SMA and the previous support line stretched from May 31, respectively near 1.1025 and 1.1095, can prod the EUR/USD bulls.
On the contrary, a downside break of the stated wedge’s bottom line, close to 1.0830 at the latest, puts a floor under the Euro pair for the short term.
Following that, the early June’s swing high of around 1.0775-80 could lure the EUR/USD sellers.
Trend: Further upside expected
Technical Levels: Supports and Resistances
EURUSD currently trading at 1.0899 at the time of writing. Pair opened at 1.0896 and is trading with a change of 0.03% % .
| Overview | Overview.1 | |
|---|---|---|
| 0 | Today last price | 1.0899 |
| 1 | Today Daily Change | 0.0003 |
| 2 | Today Daily Change % | 0.03% |
| 3 | Today daily open | 1.0896 |
The pair is trading below its 20 Daily moving average @ 1.096, below its 50 Daily moving average @ 1.098 , below its 100 Daily moving average @ 1.0931 and above its 200 Daily moving average @ 1.0794
| Trends | Trends.1 | |
|---|---|---|
| 0 | Daily SMA20 | 1.0960 |
| 1 | Daily SMA50 | 1.0980 |
| 2 | Daily SMA100 | 1.0931 |
| 3 | Daily SMA200 | 1.0794 |
The previous day high was 1.0914 while the previous day low was 1.0867. The daily 38.2% Fib levels comes at 1.0896, expected to provide support. Similarly, the daily 61.8% fib level is at 1.0885, expected to provide support.
Note the levels of interest below:
- Pivot support is noted at 1.087, 1.0845, 1.0824
- Pivot resistance is noted at 1.0917, 1.0939, 1.0964
| Levels | Levels.1 |
|---|---|
| Previous Daily High | 1.0914 |
| Previous Daily Low | 1.0867 |
| Previous Weekly High | 1.0960 |
| Previous Weekly Low | 1.0845 |
| Previous Monthly High | 1.1276 |
| Previous Monthly Low | 1.0834 |
| Daily Fibonacci 38.2% | 1.0896 |
| Daily Fibonacci 61.8% | 1.0885 |
| Daily Pivot Point S1 | 1.0870 |
| Daily Pivot Point S2 | 1.0845 |
| Daily Pivot Point S3 | 1.0824 |
| Daily Pivot Point R1 | 1.0917 |
| Daily Pivot Point R2 | 1.0939 |
| Daily Pivot Point R3 | 1.0964 |
[/s2If]
Download Nehcap EAWe have two EAs that are operational on our LIVE accounts.
- EA-FIX: Check out the details here. Download EA-FIX . EA-FIX is a non-grid HFT scalper.
- EA-GROWTH: High quality low dd EA using trend grids. Download EA_GROWTHJoin Our Telegram Group
")


