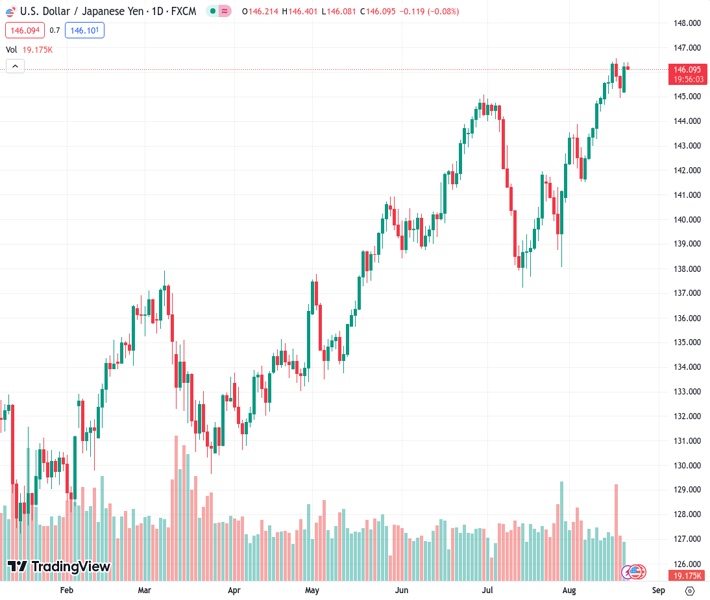
The USDJPY pair remains within a tight trading range of 146.15 to 146.40, fluctuating around the 146.162 level.
…
This is a premium post.
[s2If !current_user_can(access_s2member_level4)]Please register for FREE REGISTER to read full post below containing analysis. In case of any error or you think you are not able to read the full post below, please email us at support#nehcap.com [lwa][/s2If] [s2If current_user_can(access_s2member_level1)]
- USD/JPY oscillates around the 146.15-146.40 region in a narrow trading band.
The pair currently trades last at 146.162.
The previous day high was 146.4 while the previous day low was 145.15. The daily 38.2% Fib levels comes at 145.92, expected to provide support. Similarly, the daily 61.8% fib level is at 145.63, expected to provide support.
The USD/JPY pair currently trades near 146.37 during the Asian trading hours on Tuesday. The stronger US Dollar is supported by the rise of US US Treasury bond yields. On late Monday, the US 10-year Treasury bond yields climb to 4.35%, the highest level since 2007.
Markets believe the Bank of Japan (BoJ) could intervene by selling the Greenback around 150. It’s worth noting that the Japanese central bank prompted massive dollar selling in September and October last year as the Japanese Yen approached the 145 zone.
Furthermore, the Japan Securities Dealers Association and Nikkei Asia reported on Tuesday that foreign investors sold 1.35 trillion yen ($9.26 billion) Japanese Government Bonds (JGBs) than in the previous six months. Markets players are concerned about the BoJ policy adjustment after the central bank allowed the Yield Curve Control (YCC) band to move above the cap as long as it remains below 1.0%.
Across the pond, market players raise their bets on additional rate hikes by the Federal Reserve (Fed) despite the robust labor data and weaker inflation data. Federal Reserve (Fed) Chairman Jerome Powell Speaks on Friday will be a guide for investors and could provide insights into economic conditions. That said, the monetary policy differential between the US and Japan is the main driver of the Yen’s weakening. A hawkish tone from Fed might lift the US Dollar and support the USD/JPY pair.
Looking ahead, the preliminary Japanese Jibun Bank PMI data for August will be due on Wednesday and the top-tier data, Tokyo Consumer Price Index YoY for August will be released on Friday. On the US docket, Existing Home Sales, S&P Global PMIs, Initial Jobless Claims, and Durable Good Orders will be released later this week. Fed Chair Jerome Powell’s speech at the Jackson Hole Symposium on Friday will be the highlight of the week. Traders will find opportunities around the USD/JPY pair.
Technical Levels: Supports and Resistances
USDJPY currently trading at 146.25 at the time of writing. Pair opened at 146.22 and is trading with a change of 0.02 % .
| Overview | Overview.1 | |
|---|---|---|
| 0 | Today last price | 146.25 |
| 1 | Today Daily Change | 0.03 |
| 2 | Today Daily Change % | 0.02 |
| 3 | Today daily open | 146.22 |
The pair remains strongly bullish on the daily timeframe. It trades above its 20 SMA @ 143.47, 50 SMA 142.45, 100 SMA @ 139.32 and 200 SMA @ 136.56.
| Trends | Trends.1 | |
|---|---|---|
| 0 | Daily SMA20 | 143.47 |
| 1 | Daily SMA50 | 142.45 |
| 2 | Daily SMA100 | 139.32 |
| 3 | Daily SMA200 | 136.56 |
The previous day high was 146.4 while the previous day low was 145.15. The daily 38.2% Fib levels comes at 145.92, expected to provide support. Similarly, the daily 61.8% fib level is at 145.63, expected to provide support.
Note the levels of interest below:
- Pivot support is noted at 145.44, 144.67, 144.19
- Pivot resistance is noted at 146.7, 147.18, 147.96
| Levels | Levels.1 |
|---|---|
| Previous Daily High | 146.40 |
| Previous Daily Low | 145.15 |
| Previous Weekly High | 146.56 |
| Previous Weekly Low | 144.65 |
| Previous Monthly High | 144.91 |
| Previous Monthly Low | 137.24 |
| Daily Fibonacci 38.2% | 145.92 |
| Daily Fibonacci 61.8% | 145.63 |
| Daily Pivot Point S1 | 145.44 |
| Daily Pivot Point S2 | 144.67 |
| Daily Pivot Point S3 | 144.19 |
| Daily Pivot Point R1 | 146.70 |
| Daily Pivot Point R2 | 147.18 |
| Daily Pivot Point R3 | 147.96 |
[/s2If]
Download Nehcap EAWe have two EAs that are operational on our LIVE accounts.
- EA-FIX: Check out the details here. Download EA-FIX . EA-FIX is a non-grid HFT scalper.
- EA-GROWTH: High quality low dd EA using trend grids. Download EA_GROWTHJoin Our Telegram Group
")


