The AUDUSD pair starts the week with a decline at the price level of 0.63982 due to various factors affecting its value.
…
This is a premium post.
[s2If !current_user_can(access_s2member_level4)]Please register for FREE REGISTER to read full post below containing analysis. In case of any error or you think you are not able to read the full post below, please email us at support#nehcap.com [lwa][/s2If] [s2If current_user_can(access_s2member_level1)]
- AUD/USD kicks off the new week on a softer note and is pressured by a combination of factors.
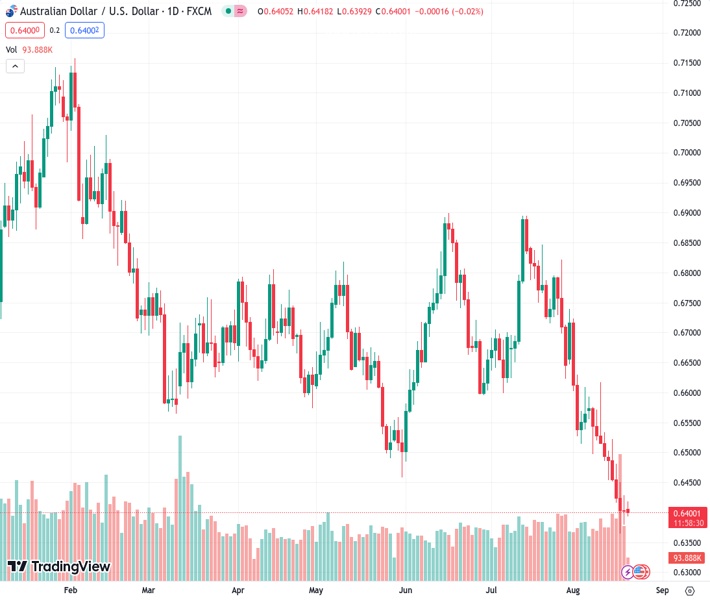
The pair currently trades last at 0.63982.
The previous day high was 0.6429 while the previous day low was 0.6379. The daily 38.2% Fib levels comes at 0.641, expected to provide resistance. Similarly, the daily 61.8% fib level is at 0.6398, expected to provide support.
The AUD/USD pair meets with some supply on the first day of a new week and trades with a mild negative bias through the early part of the European session. The pair is currently placed just below the 0.6400 round-figure mark and remains well within the striking distance of its lowest level since November 2022 touched last Thursday.
A smaller rate cut by the People’s Bank of China (PBoC) signals limited policy support for the economy despite worries about a deepening crisis in the domestic property sector. This, in turn, continues to weigh on investors’ sentiment, which is evident from a generally weaker tone around the equity markets, and undermines the risk-sensitive Australian Dollar (AUD). Apart from this, a bullish US Dollar (USD) is seen as another factor exerting some downward pressure on the AUD/USD pair.
In fact, the USD Index (DXY), which tracks the Greenback against a basket of currency, holds steady just below its highest level in more than two months in the wake of hawkish Federal Reserve (Fed) expectations. It is worth recalling that the minutes of the July 25-26 FOMC meeting showed that policymakers continued to prioritize the battle against inflation. Moreover, the incoming US macro data point to an extremely resilient economy and support prospects for further tightening by the Fed.
Meanwhile, the view that the US central bank will keep rates higher for longer remains supportive of elevated US Treasury bond yields and continues to lend support to the Greenback. This, in turn, suggests that the path of least resistance for the AUD/USD pair is to the downside. Bearish traders, however, might refrain from placing aggressive bets ahead of the crucial Jackson Hole Symposium later this week, where comments by central bankers might infuse significant volatility in the markets.
Even from a technical perspective, the recent slide below the 0.6600 mark, which confirmed the bearish double-top breakdown, validates the near-term negative outlook for the AUD/USD pair. That said, the Relative Strength Index (RSI) on the daily chart is flashing slightly oversold conditions. This might hold back bearish traders from placing aggressive bets in the absence of any relevant market-moving economic releases from the US on Monday and ahead of the key event risk.
Technical Levels: Supports and Resistances
AUDUSD currently trading at 0.6397 at the time of writing. Pair opened at 0.6411 and is trading with a change of -0.22 % .
| Overview | Overview.1 | |
|---|---|---|
| 0 | Today last price | 0.6397 |
| 1 | Today Daily Change | -0.0014 |
| 2 | Today Daily Change % | -0.2200 |
| 3 | Today daily open | 0.6411 |
The pair remains strongly bearish on the daily time frame. It trades below the 20 SMA @ 0.6574, 50 SMA 0.6676, 100 SMA @ 0.6669 and 200 SMA @ 0.6734.
| Trends | Trends.1 | |
|---|---|---|
| 0 | Daily SMA20 | 0.6574 |
| 1 | Daily SMA50 | 0.6676 |
| 2 | Daily SMA100 | 0.6669 |
| 3 | Daily SMA200 | 0.6734 |
The previous day high was 0.6429 while the previous day low was 0.6379. The daily 38.2% Fib levels comes at 0.641, expected to provide resistance. Similarly, the daily 61.8% fib level is at 0.6398, expected to provide support.
Note the levels of interest below:
- Pivot support is noted at 0.6384, 0.6356, 0.6334
- Pivot resistance is noted at 0.6433, 0.6456, 0.6483
| Levels | Levels.1 |
|---|---|
| Previous Daily High | 0.6429 |
| Previous Daily Low | 0.6379 |
| Previous Weekly High | 0.6522 |
| Previous Weekly Low | 0.6364 |
| Previous Monthly High | 0.6895 |
| Previous Monthly Low | 0.6599 |
| Daily Fibonacci 38.2% | 0.6410 |
| Daily Fibonacci 61.8% | 0.6398 |
| Daily Pivot Point S1 | 0.6384 |
| Daily Pivot Point S2 | 0.6356 |
| Daily Pivot Point S3 | 0.6334 |
| Daily Pivot Point R1 | 0.6433 |
| Daily Pivot Point R2 | 0.6456 |
| Daily Pivot Point R3 | 0.6483 |
[/s2If]
Download Nehcap EAWe have two EAs that are operational on our LIVE accounts.
- EA-FIX: Check out the details here. Download EA-FIX . EA-FIX is a non-grid HFT scalper.
- EA-GROWTH: High quality low dd EA using trend grids. Download EA_GROWTHJoin Our Telegram Group
")


