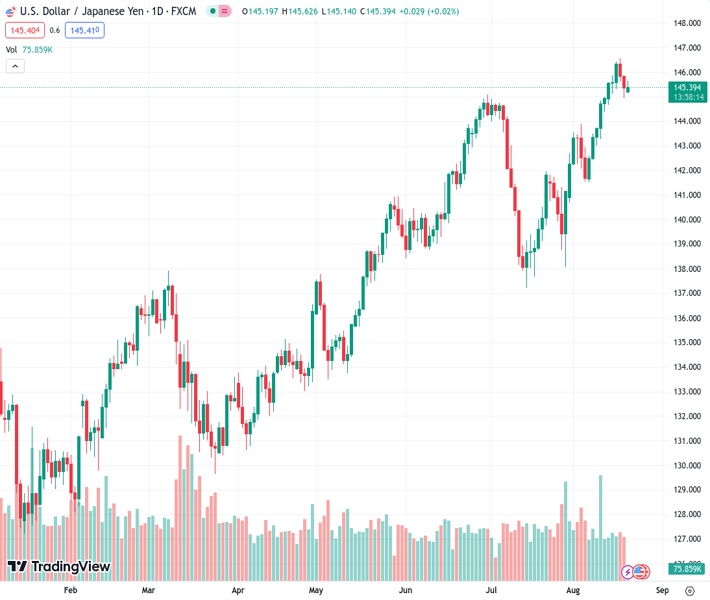
The USDJPY pair, currently at 145.442, is experiencing consolidation within a tight trading range of 145.15-145.65.
…
This is a premium post.
[s2If !current_user_can(access_s2member_level4)]Please register for FREE REGISTER to read full post below containing analysis. In case of any error or you think you are not able to read the full post below, please email us at support#nehcap.com [lwa][/s2If] [s2If current_user_can(access_s2member_level1)]
- USD/JPY consolidates around the 145.15-145.65 region in a narrow trading band.
The pair currently trades last at 145.442.
The previous day high was 145.88 while the previous day low was 144.93. The daily 38.2% Fib levels comes at 145.29, expected to provide support. Similarly, the daily 61.8% fib level is at 145.51, expected to provide resistance.
The USD/JPY pair oscillates in a narrow range below the mid-145.00s heading into the early Asian session on Monday. Traders prefer to wait on the sidelines amid the risk-averse mood and await the Federal Reserve (Fed) Chairman Jerome Powell Speaks at the Jackson Hole Symposium on Friday. The major pair currently trades near 145.43, gaining 0.03% on the day.
Meanwhile, traders will keep an eye on the potential intervention by the Bank of Japan (BoJ). The Japanese government may step in to prevent the Japanese Yen. However, the monetary policy differential between the US and Japan is the main driver of the Yen’s weakening.
According to the four-hour chart, the USD/JPY pair stands above the 50- and 100-hour Exponential Moving Averages (EMAs) with an upward slope, which means the path of least resistance is to the upside for the major pair.
That said, the key contention level for the major pair is seen at the 144.90-145.00 region, representing a confluence of the lower limit of the Bollinger Band and 100-hour EMA. The additional downside filter is seen at 144.40 (low of August 11), followed by 144.00 (100-hour EMA), and finally at 143.30 (low of August 10).
On the upside, the immediate resistance level for USD/JPY appears at 145.85 (high of August 15). The critical barrier for the pair is seen at a YTD high and the boundary of the Bollinger Band of 146.55. Any meaningful follow-through buying above the latter would challenge a psychological round figure at 147.00, which will be a tough nut to crack for the USD/JPY pair.
It’s worth noting that the Relative Strength Index (RSI) stands below 50 and Moving Average Convergence/Divergence (MACD) stays in bearish territory, which indicates that the upside momentum has been activated for the time being.
Technical Levels: Supports and Resistances
USDJPY currently trading at 145.43 at the time of writing. Pair opened at 145.4 and is trading with a change of 0.02 % .
| Overview | Overview.1 | |
|---|---|---|
| 0 | Today last price | 145.43 |
| 1 | Today Daily Change | 0.03 |
| 2 | Today Daily Change % | 0.02 |
| 3 | Today daily open | 145.40 |
The pair remains strongly bullish on the daily timeframe. It trades above its 20 SMA @ 143.23, 50 SMA 142.32, 100 SMA @ 139.19 and 200 SMA @ 136.53.
| Trends | Trends.1 | |
|---|---|---|
| 0 | Daily SMA20 | 143.23 |
| 1 | Daily SMA50 | 142.32 |
| 2 | Daily SMA100 | 139.19 |
| 3 | Daily SMA200 | 136.53 |
The previous day high was 145.88 while the previous day low was 144.93. The daily 38.2% Fib levels comes at 145.29, expected to provide support. Similarly, the daily 61.8% fib level is at 145.51, expected to provide resistance.
Note the levels of interest below:
- Pivot support is noted at 144.93, 144.45, 143.98
- Pivot resistance is noted at 145.87, 146.35, 146.82
| Levels | Levels.1 |
|---|---|
| Previous Daily High | 145.88 |
| Previous Daily Low | 144.93 |
| Previous Weekly High | 146.56 |
| Previous Weekly Low | 144.65 |
| Previous Monthly High | 144.91 |
| Previous Monthly Low | 137.24 |
| Daily Fibonacci 38.2% | 145.29 |
| Daily Fibonacci 61.8% | 145.51 |
| Daily Pivot Point S1 | 144.93 |
| Daily Pivot Point S2 | 144.45 |
| Daily Pivot Point S3 | 143.98 |
| Daily Pivot Point R1 | 145.87 |
| Daily Pivot Point R2 | 146.35 |
| Daily Pivot Point R3 | 146.82 |
[/s2If]
Download Nehcap EAWe have two EAs that are operational on our LIVE accounts.
- EA-FIX: Check out the details here. Download EA-FIX . EA-FIX is a non-grid HFT scalper.
- EA-GROWTH: High quality low dd EA using trend grids. Download EA_GROWTHJoin Our Telegram Group
")


