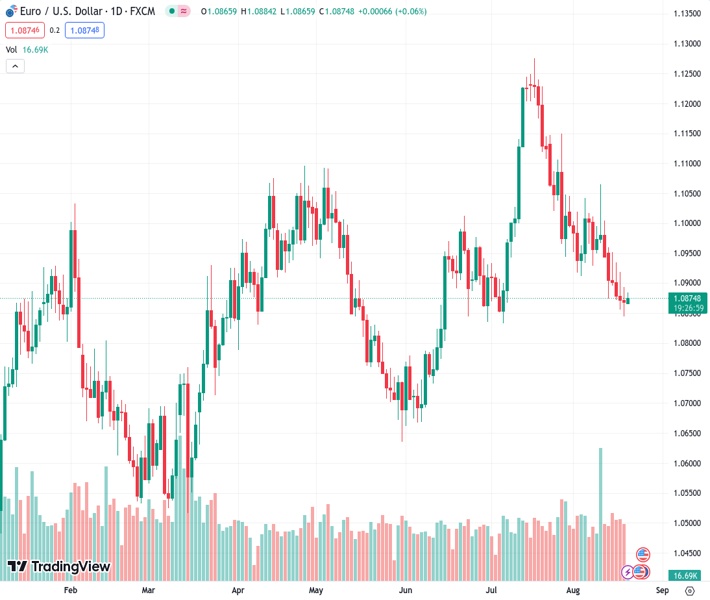
On Monday, the currency pair EUR/USD trading at 1.08736 caught the attention of buyers, bringing an end to its six-day decline and reaching a low not seen in six weeks.
…
This is a premium post.
[s2If !current_user_can(access_s2member_level4)]Please register for FREE REGISTER to read full post below containing analysis. In case of any error or you think you are not able to read the full post below, please email us at support#nehcap.com [lwa][/s2If] [s2If current_user_can(access_s2member_level1)]
- EUR/USD attracts some buyers on Monday and snaps a six-day losing streak to a six-week low.
The pair currently trades last at 1.08736.
The previous day high was 1.0894 while the previous day low was 1.0845. The daily 38.2% Fib levels comes at 1.0864, expected to provide support. Similarly, the daily 61.8% fib level is at 1.0875, expected to provide resistance.
The EUR/USD pair gains some positive traction on the first day of a new week and for now, seems to have snapped a six-day losing streak to its lowest level since July 6, around the 1.0845 area touched on Friday. Spot prices, however, lack bullish conviction and remain below the 1.0900 mark through the Asian session, warranting caution before positioning for any meaningful intraday appreciating move.
The US Dollar (USD) kicks off the new week on a subdued note and consolidates its recent gains to its highest level since July 12, which, in turn, is seen as a key factor lending some support to the EUR/USD pair. That said, firming expectations that the Federal Reserve (Fed) will keep interest rates higher for longer continue to act as a tailwind for the Greenback and hold back traders from placing fresh bullish bets around the major.
The US central bank is anticipated to pause its rate-hiking cycle in September, though the markets have been pricing in one more 25 bps lift-off by the end of this year. The bets were reaffirmed by the latest US CPI report, which showed a moderate rise in consumer prices in July. Adding to this, the US PPI climbed slightly more than expected and suggested that the battle to bring inflation back to the Fed’s 2% target is far from being won.
Furthermore, the minutes from the July 25-26 FOMC meeting revealed that policymakers continued to prioritize the battle against inflation. Meanwhile, the incoming US macro data continues to point to an extremely resilient economy and should allow the Fed to stick to its hawkish stance. The outlook remains supportive of elevated US Treasury bond yields, which, along with looming recession risks, act as a tailwind for the buck and cap the EUR/USD pair.
Apart from this, speculations that the European Central Bank (ECB) will halt its streak of nine consecutive rate hikes in September might further contribute to keeping a lid on the EUR/USD pair. Traders might also refrain from placing aggressive bets ahead of the crucial Jackson Hole Symposium later this week, where comments by central bankers might infuse significant volatility in the markets. This further warrants some caution for aggressive bulls.
The aforementioned fundamental backdrop makes it prudent to wait for strong follow-through buying before confirming that the recent downtrend witnessed over the past month or so has run its course. Traders now look to the release of the German PPI and Buba Monthly Report, which might influence the shared currency and provide some impetus to the EUR/USD pair in the absence of any relevant market-moving economic data from the US on Monday.
Technical Levels: Supports and Resistances
EURUSD currently trading at 1.0876 at the time of writing. Pair opened at 1.0872 and is trading with a change of 0.04 % .
| Overview | Overview.1 | |
|---|---|---|
| 0 | Today last price | 1.0876 |
| 1 | Today Daily Change | 0.0004 |
| 2 | Today Daily Change % | 0.0400 |
| 3 | Today daily open | 1.0872 |
The pair is trading below its 20 Daily moving average @ 1.0969, below its 50 Daily moving average @ 1.0978 , below its 100 Daily moving average @ 1.0931 and above its 200 Daily moving average @ 1.0791
| Trends | Trends.1 | |
|---|---|---|
| 0 | Daily SMA20 | 1.0969 |
| 1 | Daily SMA50 | 1.0978 |
| 2 | Daily SMA100 | 1.0931 |
| 3 | Daily SMA200 | 1.0791 |
The previous day high was 1.0894 while the previous day low was 1.0845. The daily 38.2% Fib levels comes at 1.0864, expected to provide support. Similarly, the daily 61.8% fib level is at 1.0875, expected to provide resistance.
Note the levels of interest below:
- Pivot support is noted at 1.0846, 1.0821, 1.0798
- Pivot resistance is noted at 1.0895, 1.0919, 1.0944
| Levels | Levels.1 |
|---|---|
| Previous Daily High | 1.0894 |
| Previous Daily Low | 1.0845 |
| Previous Weekly High | 1.0960 |
| Previous Weekly Low | 1.0845 |
| Previous Monthly High | 1.1276 |
| Previous Monthly Low | 1.0834 |
| Daily Fibonacci 38.2% | 1.0864 |
| Daily Fibonacci 61.8% | 1.0875 |
| Daily Pivot Point S1 | 1.0846 |
| Daily Pivot Point S2 | 1.0821 |
| Daily Pivot Point S3 | 1.0798 |
| Daily Pivot Point R1 | 1.0895 |
| Daily Pivot Point R2 | 1.0919 |
| Daily Pivot Point R3 | 1.0944 |
[/s2If]
Download Nehcap EAWe have two EAs that are operational on our LIVE accounts.
- EA-FIX: Check out the details here. Download EA-FIX . EA-FIX is a non-grid HFT scalper.
- EA-GROWTH: High quality low dd EA using trend grids. Download EA_GROWTHJoin Our Telegram Group
")


