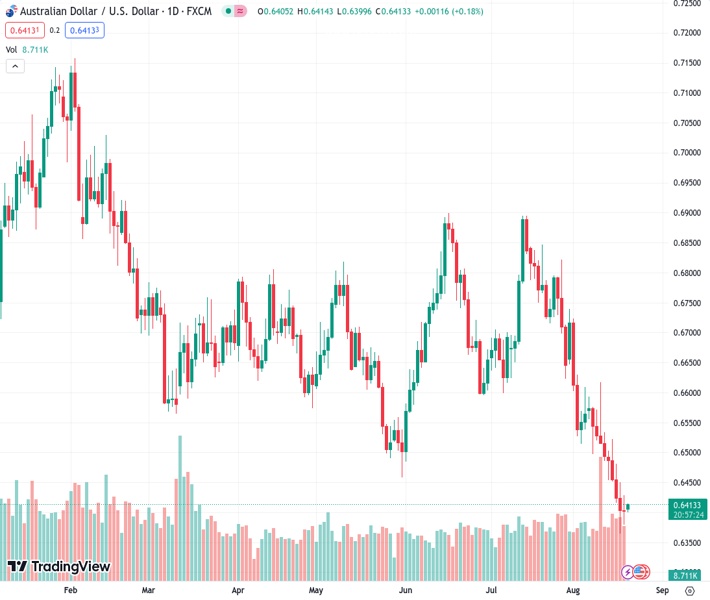
The AUDUSD pair, currently at 0.64136, continues to remain at its lowest level for the year, after experiencing a five-week period of consecutive losses, which has contributed to its depressed state.
…
This is a premium post.
[s2If !current_user_can(access_s2member_level4)]Please register for FREE REGISTER to read full post below containing analysis. In case of any error or you think you are not able to read the full post below, please email us at support#nehcap.com [lwa][/s2If] [s2If current_user_can(access_s2member_level1)]
- AUD/USD remains depressed at YTD low after five-week losing streak.
The pair currently trades last at 0.64136.
The previous day high was 0.6429 while the previous day low was 0.6379. The daily 38.2% Fib levels comes at 0.641, expected to provide support. Similarly, the daily 61.8% fib level is at 0.6398, expected to provide support.
AUD/USD holds lower grounds near 0.6400, struggling for clear directions after refreshing the yearly low during a five-week downtrend. The Aussie pair’s latest inaction could be linked to the hopes of more stimulus from China and the cautious mood ahead of the People’s Bank of China’s (PBoC) Interest Rate Decision. More importantly, the market’s consolidation ahead of the August month Purchasing Managers Indexes (PMIs) and Jackson Hole Symposium prods the risk-barometer pair.
During the weekend, China’s top-tier financial authorities gather to discuss the market’s concerns about the spillover effects from the nation’s reality sector debt crisis, as well as doubts about the local government bonds. Following the meeting, the officials showed readiness for more stimulus and put a floor under the riskier assets.
Previously, the People’s Bank of China (PBOC), surprised markets by lowering the one-year Medium-term Lending Facility (MLF) rate to 2.50% from 2.65% previous, as well as by cutting the Reverse Repo Rate to 1.8% from 1.9% previously. That said, the PBoC also cut Statutory Liquidity Financial Ratio (SLF) in the last week. It’s worth observing that China’s Retail Sales and Industrial Production disappointed and joined the fears of the debt market crisis, as well as the easing economic recovery, to weigh on the AUD/USD price.
That said, Australia’s headline employment data were disappointing for July and joined the downbeat Reserve Bank of Australia (RBA) Minutes to exert additional downside pressure on the Aussie pair. It’s worth noting that the softer readings of the quarterly Wage Price Index also favored the AUD/USD bears.
On the other hand, The upbeat US second-tier manufacturing activity numbers, Retail Sales and wage growth allowed the US Dollar to remain firmer for the fifth consecutive week, especially backed by the hawkish Fed Minutes. Also keeping the Greenback firmer was the risk-off mood and the upbeat Treasury bond yields. With this, US Dollar Index (DXY) grew in the last five consecutive weeks, to 103.40 at the latest.
Amid these plays, Wall Street closed mixed on Friday but marked a heavy weekly loss whereas the US Treasury bond yields retreat after a strongly negative week for the equities and the upbeat bound coupons.
Moving on, the PBoC Interest Rate Decision and the headlines about China may entertain the AUD/USD pair traders ahead of Wednesday’s preliminary PMIs for August and the late-week headlines from the Kansas Fed’s annual event for central bankers, namely the Jackson Hole Symposium.
Unless providing a daily closing beyond a five-week-old descending resistance line, around 0.6490 by the press time, the AUD/USD pair remains on the seller’s radar.
Technical Levels: Supports and Resistances
AUDUSD currently trading at 0.6408 at the time of writing. Pair opened at 0.6411 and is trading with a change of -0.05% % .
| Overview | Overview.1 | |
|---|---|---|
| 0 | Today last price | 0.6408 |
| 1 | Today Daily Change | -0.0003 |
| 2 | Today Daily Change % | -0.05% |
| 3 | Today daily open | 0.6411 |
The pair remains strongly bearish on the daily time frame. It trades below the 20 SMA @ 0.6574, 50 SMA 0.6676, 100 SMA @ 0.6669 and 200 SMA @ 0.6734.
| Trends | Trends.1 | |
|---|---|---|
| 0 | Daily SMA20 | 0.6574 |
| 1 | Daily SMA50 | 0.6676 |
| 2 | Daily SMA100 | 0.6669 |
| 3 | Daily SMA200 | 0.6734 |
The previous day high was 0.6429 while the previous day low was 0.6379. The daily 38.2% Fib levels comes at 0.641, expected to provide support. Similarly, the daily 61.8% fib level is at 0.6398, expected to provide support.
Note the levels of interest below:
- Pivot support is noted at 0.6384, 0.6356, 0.6334
- Pivot resistance is noted at 0.6433, 0.6456, 0.6483
| Levels | Levels.1 |
|---|---|
| Previous Daily High | 0.6429 |
| Previous Daily Low | 0.6379 |
| Previous Weekly High | 0.6522 |
| Previous Weekly Low | 0.6364 |
| Previous Monthly High | 0.6895 |
| Previous Monthly Low | 0.6599 |
| Daily Fibonacci 38.2% | 0.6410 |
| Daily Fibonacci 61.8% | 0.6398 |
| Daily Pivot Point S1 | 0.6384 |
| Daily Pivot Point S2 | 0.6356 |
| Daily Pivot Point S3 | 0.6334 |
| Daily Pivot Point R1 | 0.6433 |
| Daily Pivot Point R2 | 0.6456 |
| Daily Pivot Point R3 | 0.6483 |
[/s2If]
Download Nehcap EAWe have two EAs that are operational on our LIVE accounts.
- EA-FIX: Check out the details here. Download EA-FIX . EA-FIX is a non-grid HFT scalper.
- EA-GROWTH: High quality low dd EA using trend grids. Download EA_GROWTHJoin Our Telegram Group
")


