China’s economy shows signs of trouble as retail sales decline, imports and exports plummet, and Evergrande files for bankruptcy.
…
This is a premium post.
[s2If !current_user_can(access_s2member_level4)]Please register for FREE REGISTER to read full post below containing analysis. In case of any error or you think you are not able to read the full post below, please email us at support#nehcap.com [lwa][/s2If] [s2If current_user_can(access_s2member_level1)]
- China’s economic indicators signal distress, with weak retail sales, plunging imports/exports, and Evergrande’s bankruptcy filing.
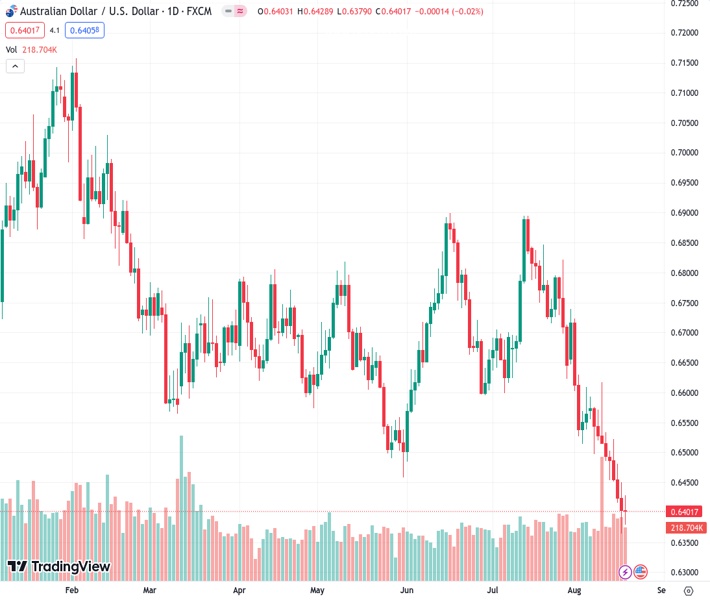
The pair currently trades last at 0.64017.
The previous day high was 0.645 while the previous day low was 0.6364. The daily 38.2% Fib levels comes at 0.6397, expected to provide support. Similarly, the daily 61.8% fib level is at 0.6418, expected to provide resistance.
AUD/USD registers minuscule losses though it registered weekly losses of 1.41%, as market sentiment remained downbeat amid China’s economic developments, denting investors’ mood. That, alongside global bond yields portraying traders expecting additional tightening, kept the Australian Dollar (AUD) pressured for the eighth consecutive day. The AUD/USD finished the week trading at 0.6401, down 0.02%.
During the last two weeks, China’s economic docket paints a troubled economic outlook, as retail sales were weaker than expected, imports and exports plunged, and business activity stalled. That, alongside news that Evergrande’s filing for bankruptcy in New York, added to the ongoing economic turmoil of the second-largest economy worldwide.
In the meantime, the latest US Federal Reserve monetary policy minutes, revealed on Wednesday, showed policymakers’ commitment to curb inflation towards its 2% target. In fact, most participants noted that further tightening is required, hurting investors’ speculations the central bank would give signs of pausing or ending its tightening cycle.
Nevertheless, it seems traders overreacted, as there have been growing voices among the Fed’s board to not overtightening monetary conditions. Regional Fed Presidents Bostic, Harker, Golsbee, and Barkin, stated that rates are restrictive, and the US central bank could be “patient” regarding future decisions. Consequently, the CME FedWatch Tool shows that market players expect the Fed to hold rates in September, but November’s meeting would be live.
AUD/USD traders’ focus shifts to next week’s data. In Australia, S&P Global PMIs are expected to remain unchanged. On the US front, Fed speakers, housing data, PMIs, durable goods orders, and Fed Chair Jerome Powell’s speech at Jackson Hole could rock the boat after volatility continued to shrink throughout August.
The AUD/USD downtrend remains intact, though it failed to achieve a daily close below the November 10 low of 0.6386, keeping buyers hopeful of higher prices. Despite that, AUD/USD could re-test 0.6400, followed by the new year-to-date (YTD) low challenge at 0.6364. A decisive break below the latter, expect the AUD/USD to visit the November 3 swing low of 0.6272, ahead of the 0.6200 figure. Otherwise, the AUD/USD could aim towards the May 31 low of 0.6458 before challenging the 0.6500 mark.
Technical Levels: Supports and Resistances
AUDUSD currently trading at 0.6411 at the time of writing. Pair opened at 0.6404 and is trading with a change of 0.11 % .
| Overview | Overview.1 | |
|---|---|---|
| 0 | Today last price | 0.6411 |
| 1 | Today Daily Change | 0.0007 |
| 2 | Today Daily Change % | 0.1100 |
| 3 | Today daily open | 0.6404 |
The pair remains strongly bearish on the daily time frame. It trades below the 20 SMA @ 0.659, 50 SMA 0.6682, 100 SMA @ 0.6672 and 200 SMA @ 0.6736.
| Trends | Trends.1 | |
|---|---|---|
| 0 | Daily SMA20 | 0.6590 |
| 1 | Daily SMA50 | 0.6682 |
| 2 | Daily SMA100 | 0.6672 |
| 3 | Daily SMA200 | 0.6736 |
The previous day high was 0.645 while the previous day low was 0.6364. The daily 38.2% Fib levels comes at 0.6397, expected to provide support. Similarly, the daily 61.8% fib level is at 0.6418, expected to provide resistance.
Note the levels of interest below:
- Pivot support is noted at 0.6362, 0.632, 0.6276
- Pivot resistance is noted at 0.6448, 0.6492, 0.6534
| Levels | Levels.1 |
|---|---|
| Previous Daily High | 0.6450 |
| Previous Daily Low | 0.6364 |
| Previous Weekly High | 0.6617 |
| Previous Weekly Low | 0.6486 |
| Previous Monthly High | 0.6895 |
| Previous Monthly Low | 0.6599 |
| Daily Fibonacci 38.2% | 0.6397 |
| Daily Fibonacci 61.8% | 0.6418 |
| Daily Pivot Point S1 | 0.6362 |
| Daily Pivot Point S2 | 0.6320 |
| Daily Pivot Point S3 | 0.6276 |
| Daily Pivot Point R1 | 0.6448 |
| Daily Pivot Point R2 | 0.6492 |
| Daily Pivot Point R3 | 0.6534 |
[/s2If]
Download Nehcap EAWe have two EAs that are operational on our LIVE accounts.
- EA-FIX: Check out the details here. Download EA-FIX . EA-FIX is a non-grid HFT scalper.
- EA-GROWTH: High quality low dd EA using trend grids. Download EA_GROWTHJoin Our Telegram Group
")


