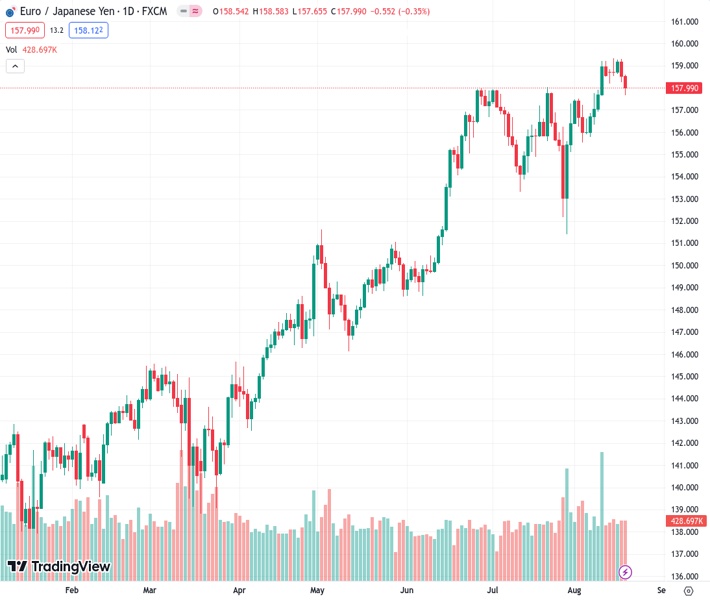
The currency pair EURJPY, which was at a rate of 157.968, slightly decreased and approached the level of 158.00. However, it is still being traded at relatively high levels.
…
This is a premium post.
[s2If !current_user_can(access_s2member_level4)]Please register for FREE REGISTER to read full post below containing analysis. In case of any error or you think you are not able to read the full post below, please email us at support#nehcap.com [lwa][/s2If] [s2If current_user_can(access_s2member_level1)]
- EUR/JPY dropped near 158.00, still trading in cycle highs.
The pair currently trades last at 157.968.
The previous day high was 159.3 while the previous day low was 158.26. The daily 38.2% Fib levels comes at 158.65, expected to provide resistance. Similarly, the daily 61.8% fib level is at 158.9, expected to provide resistance.
On Friday, the JPY traded strongly against most of its rivals, making the EUR/JPY cross retreat to the 158.00 area. In that sense, inflation data fueled some hopes of the Bank of Japan (BoJ) pivoting, but more evidence may be needed for the bank as their eyes are also set on the Chinese financial woes. On the EUR side, the Harmonized Index of Consumer Prices (HICP) revisions from July didn’t reveal any surprise.
Japan reported the July National Consumer Price Index (CPI), which came higher than expected. The headline figure came in at 3.3% YoY vs the 2.5% expected and matched the previous figure of 3.3%. In addition, the Core measures excluding energy, food and non-fresh food matched expectations. As a reaction, the JPY is trading strong against most of its rivals, but this inflation figure may be different from what the Bank of Japan (BoJ) expects to see to pivot as economic figures showed weakness during the week. In addition, the bank closely watches the Chinese situation, and they won’t rush to leave their accommodative stance.
On the European side, the Harmonized Index of Consumer Prices (HICP) revisions for July from the European Union didn’t reveal any surprises. They confirmed a monthly contraction for the Core measure. In addition, the dovish narrative amongst the European Central Bank (ECB) officials limits the EUR and decreases German bond yields.
In that sense, the Euro is somewhat soft, as markets received a dovish signal from European Central Bank’s (ECB) Martin Kazaks as he stated on Thursday, “If we look at the coming months, if there’ll be increases in interest rates, then they’ll be very small.” Eventually, it will come down to the incoming data due to the data-dependency approach of the bank, and according to the World Interest Rate Possibilities (WIRP) tool, markets are still indecisive regarding the next September meeting as they price in only 50% odds of a 25 basis point hike. Still, those possibilities rise to 80% and 90% in October and December.
Based on the daily chart, EUR/JPY maintains a neutral to bearish technical perspective, suggesting that the bears gradually gain momentum but are not yet fully in control. The Relative Strength Index (RSI) points towards a potential reversal, as its positive slope above the midline weakens, while the Moving Average Convergence (MACD) prints shorter green bars. The pair is above the 20,100 and 200-day Simple Moving Averages (SMAs), indicating that the buyers still dominate the broader perspective.
Support levels: 156.00, 155.50, 155.00.
Resistance levels: 159.00, 160.00, 160.50.
Technical Levels: Supports and Resistances
EURJPY currently trading at 158.07 at the time of writing. Pair opened at 158.56 and is trading with a change of -0.31 % .
| Overview | Overview.1 | |
|---|---|---|
| 0 | Today last price | 158.07 |
| 1 | Today Daily Change | -0.49 |
| 2 | Today Daily Change % | -0.31 |
| 3 | Today daily open | 158.56 |
The pair remains strongly bullish on the daily timeframe. It trades above its 20 SMA @ 157.09, 50 SMA 156.06, 100 SMA @ 152.0 and 200 SMA @ 147.27.
| Trends | Trends.1 | |
|---|---|---|
| 0 | Daily SMA20 | 157.09 |
| 1 | Daily SMA50 | 156.06 |
| 2 | Daily SMA100 | 152.00 |
| 3 | Daily SMA200 | 147.27 |
The previous day high was 159.3 while the previous day low was 158.26. The daily 38.2% Fib levels comes at 158.65, expected to provide resistance. Similarly, the daily 61.8% fib level is at 158.9, expected to provide resistance.
Note the levels of interest below:
- Pivot support is noted at 158.11, 157.66, 157.07
- Pivot resistance is noted at 159.16, 159.75, 160.2
| Levels | Levels.1 |
|---|---|
| Previous Daily High | 159.30 |
| Previous Daily Low | 158.26 |
| Previous Weekly High | 159.22 |
| Previous Weekly Low | 155.81 |
| Previous Monthly High | 158.05 |
| Previous Monthly Low | 151.41 |
| Daily Fibonacci 38.2% | 158.65 |
| Daily Fibonacci 61.8% | 158.90 |
| Daily Pivot Point S1 | 158.11 |
| Daily Pivot Point S2 | 157.66 |
| Daily Pivot Point S3 | 157.07 |
| Daily Pivot Point R1 | 159.16 |
| Daily Pivot Point R2 | 159.75 |
| Daily Pivot Point R3 | 160.20 |
[/s2If]
Download Nehcap EAWe have two EAs that are operational on our LIVE accounts.
- EA-FIX: Check out the details here. Download EA-FIX . EA-FIX is a non-grid HFT scalper.
- EA-GROWTH: High quality low dd EA using trend grids. Download EA_GROWTHJoin Our Telegram Group
")


