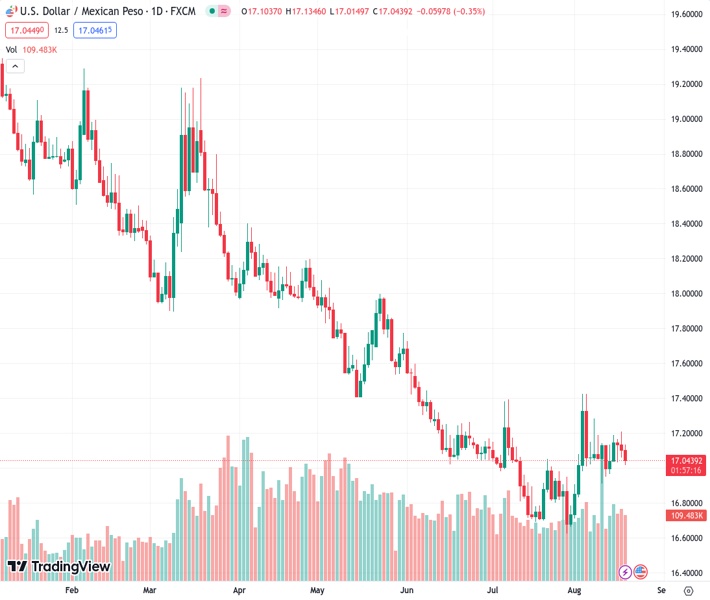
The US dollar to Mexican peso exchange rate is at 17.0435, and in June, the retail sales in Mexico increased by 2.9% compared to the previous month, which is much higher than the expected growth of 0.9%.
…
This is a premium post.
[s2If !current_user_can(access_s2member_level4)]Please register for FREE REGISTER to read full post below containing analysis. In case of any error or you think you are not able to read the full post below, please email us at support#nehcap.com [lwa][/s2If] [s2If current_user_can(access_s2member_level1)]
- Mexican Retail Sales for June surge to 2.9% MoM, significantly outpacing the anticipated 0.9% growth.
The pair currently trades last at 17.0435.
The previous day high was 17.2094 while the previous day low was 17.0601. The daily 38.2% Fib levels comes at 17.1171, expected to provide resistance. Similarly, the daily 61.8% fib level is at 17.1524, expected to provide resistance.
The USD/MXN drops below the 17.0500 figure after traveling from weekly highs of 17.2073, preparing to finish the week with modest gains of 0.14%. Usually, risk aversion sees flows toward the Greenback in emerging market currency pairs vs. the former, but not on this occasion. At the time of writing, the USD/MXN is trading at 17.0170, down 0.51%.
The Mexican Peso (MXN) recovered some ground after Retail Sales in June exceeded estimates according to the Instituto Nacional de Estadistica Geografia e Informatica (INEGI), with sales coming at 2.9% MoM, above a 0.9% expansion foreseen. Annually basis, sales jumped by 5.9%, crushing estimates of 2.9%. At the same time, a preliminary reading from INEGI showed that Mexican’s economy grew 3.4% in July.
It should be said the Bank of Mexico (Banxico), the Mexican central bank, has kept rates on hold during the last two meetings and is expected to keep them around 11.25% in the foreseeable future. Meanwhile, the swaps markets speculate Banxico would cut rates by the end of 2023.
Across the border, the US economic agenda revealed solid data during the week, led by retail sales pushing above forecasts and a robust labor market justifying the Federal Reserve’s (Fed) need to maintain its restrictive stance regarding monetary policy. The Fed’s latest monetary policy meeting minutes emphasized the US central bank commitment to bring inflation towards its 2% target, though some officials began to be cautious about upcoming meetings.
In the meantime, the US Dollar Index (DXY), a gauge of the buck’s value against a basket of six peers, hovered around two-month highs but retraced to 103.353, almost flat. The US Treasury bond yields pare some of its losses, with the US 10-year Treasury note yielding 4.255%, down two bps.
The USD/MXN bias remains downwards but it appears to have bottomed at around 17.0000. A daily close below the latter would expose the year-to-date (YTD) low of 16.6238, followed by the October 2015 swing low of 16.3267. Contrarily, if USD/MXN remains above 17.0000, the 20-day Moving Average (DMA) at 17.0189 would be up for grabs.
Technical Levels: Supports and Resistances
USDMXN currently trading at 17.0351 at the time of writing. Pair opened at 17.1059 and is trading with a change of -0.41 % .
| Overview | Overview.1 | |
|---|---|---|
| 0 | Today last price | 17.0351 |
| 1 | Today Daily Change | -0.0708 |
| 2 | Today Daily Change % | -0.4100 |
| 3 | Today daily open | 17.1059 |
The pair is trading above its 20 Daily moving average @ 17.002, above its 50 Daily moving average @ 17.0329 , below its 100 Daily moving average @ 17.4402 and below its 200 Daily moving average @ 18.2028
| Trends | Trends.1 | |
|---|---|---|
| 0 | Daily SMA20 | 17.0020 |
| 1 | Daily SMA50 | 17.0329 |
| 2 | Daily SMA100 | 17.4402 |
| 3 | Daily SMA200 | 18.2028 |
The previous day high was 17.2094 while the previous day low was 17.0601. The daily 38.2% Fib levels comes at 17.1171, expected to provide resistance. Similarly, the daily 61.8% fib level is at 17.1524, expected to provide resistance.
Note the levels of interest below:
- Pivot support is noted at 17.0409, 16.9759, 16.8916
- Pivot resistance is noted at 17.1902, 17.2744, 17.3394
| Levels | Levels.1 |
|---|---|
| Previous Daily High | 17.2094 |
| Previous Daily Low | 17.0601 |
| Previous Weekly High | 17.2852 |
| Previous Weekly Low | 16.9101 |
| Previous Monthly High | 17.3957 |
| Previous Monthly Low | 16.6258 |
| Daily Fibonacci 38.2% | 17.1171 |
| Daily Fibonacci 61.8% | 17.1524 |
| Daily Pivot Point S1 | 17.0409 |
| Daily Pivot Point S2 | 16.9759 |
| Daily Pivot Point S3 | 16.8916 |
| Daily Pivot Point R1 | 17.1902 |
| Daily Pivot Point R2 | 17.2744 |
| Daily Pivot Point R3 | 17.3394 |
[/s2If]
Download Nehcap EAWe have two EAs that are operational on our LIVE accounts.
- EA-FIX: Check out the details here. Download EA-FIX . EA-FIX is a non-grid HFT scalper.
- EA-GROWTH: High quality low dd EA using trend grids. Download EA_GROWTHJoin Our Telegram Group
")


