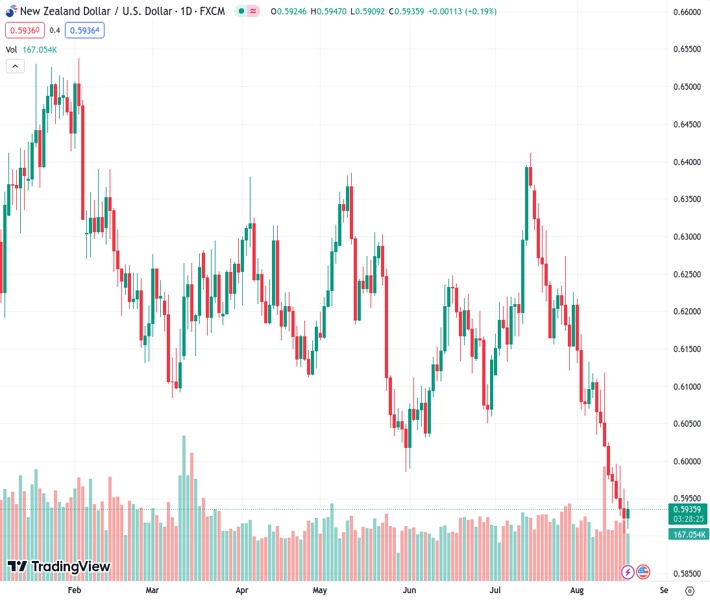
The NZDUSD currency pair, currently trading at 0.59341, is regaining some ground and moving closer to 0.5940. However, it is on track to record its fifth consecutive weekly decline.
…
This is a premium post.
[s2If !current_user_can(access_s2member_level4)]Please register for FREE REGISTER to read full post below containing analysis. In case of any error or you think you are not able to read the full post below, please email us at support#nehcap.com [lwa][/s2If] [s2If current_user_can(access_s2member_level1)]
- NZD/USD consolidates its loses and jumps near 0.5940, but it will set its fifth consecutive weekly loss.
The pair currently trades last at 0.59341.
The previous day high was 0.5967 while the previous day low was 0.5903. The daily 38.2% Fib levels comes at 0.5927, expected to provide support. Similarly, the daily 61.8% fib level is at 0.5942, expected to provide resistance.
On Friday, the NZD/USD recovered some ground as the pair corrected oversold conditions on the daily chart. On the one hand, the Kiwi got a boost from the Reserve Bank of New Zealand (RBNZ) Deputy Governor Silk’s messages, while the USD, measured by the DXY index, traded at its highest point since mid June.
The DXY index consolidated itself above its 200-day Simple Moving Average (SMA) and jumped to 103.60, its highest level since June 13 and then settled at 103.30. Factors driving the USD upwards during the week included the hawkish stance seen by the Federal Open Market Committee (FOMC) in Wednesday’s minutes from the July meeting, which boosted US yields and the sour market mood due to the worrying Chinese economic situation. In line with that, markets grew concerned due to Evergrande filing for protection from creditors in a US bankruptcy court.
On the Kiwi’s side, the Reserve Bank of New Zealand (RBNZ) Deputy Governor Karen Silk delivered some hawkish messages and warned that upside risk to inflation may push the bank to retain rates higher for a longer time. As a reaction, the NZD is trading strong against most of its rivals and is one of the session’s top performers alongside the JPY and the USD.
According to the daily chart, the technical outlook for the NZD/USD remains neutral to bearish as the bulls show signs of recovery. With an ascending slope in oversold territory, the Relative Strength Index (RSI) suggests a potential increase in buying pressure, while the Moving Average Convergence (MACD) displays weaker red bars. On the other hand, the pair is below the 20,100 and 200-day Simple Moving Averages (SMAs), suggesting that the bears are firmly in control of the bigger picture, leaving the buyers vulnerable.
Support levels: 0.5930, 0.5910, 0.5900.
Resistance levels: 0.6000, 0.6020, 0.6050.
Technical Levels: Supports and Resistances
NZDUSD currently trading at 0.5942 at the time of writing. Pair opened at 0.5927 and is trading with a change of 0.25 % .
| Overview | Overview.1 | |
|---|---|---|
| 0 | Today last price | 0.5942 |
| 1 | Today Daily Change | 0.0015 |
| 2 | Today Daily Change % | 0.2500 |
| 3 | Today daily open | 0.5927 |
The pair remains strongly bearish on the daily time frame. It trades below the 20 SMA @ 0.6088, 50 SMA 0.6155, 100 SMA @ 0.6173 and 200 SMA @ 0.6233.
| Trends | Trends.1 | |
|---|---|---|
| 0 | Daily SMA20 | 0.6088 |
| 1 | Daily SMA50 | 0.6155 |
| 2 | Daily SMA100 | 0.6173 |
| 3 | Daily SMA200 | 0.6233 |
The previous day high was 0.5967 while the previous day low was 0.5903. The daily 38.2% Fib levels comes at 0.5927, expected to provide support. Similarly, the daily 61.8% fib level is at 0.5942, expected to provide resistance.
Note the levels of interest below:
- Pivot support is noted at 0.5898, 0.5868, 0.5834
- Pivot resistance is noted at 0.5961, 0.5996, 0.6025
| Levels | Levels.1 |
|---|---|
| Previous Daily High | 0.5967 |
| Previous Daily Low | 0.5903 |
| Previous Weekly High | 0.6118 |
| Previous Weekly Low | 0.5974 |
| Previous Monthly High | 0.6413 |
| Previous Monthly Low | 0.6120 |
| Daily Fibonacci 38.2% | 0.5927 |
| Daily Fibonacci 61.8% | 0.5942 |
| Daily Pivot Point S1 | 0.5898 |
| Daily Pivot Point S2 | 0.5868 |
| Daily Pivot Point S3 | 0.5834 |
| Daily Pivot Point R1 | 0.5961 |
| Daily Pivot Point R2 | 0.5996 |
| Daily Pivot Point R3 | 0.6025 |
[/s2If]
Download Nehcap EAWe have two EAs that are operational on our LIVE accounts.
- EA-FIX: Check out the details here. Download EA-FIX . EA-FIX is a non-grid HFT scalper.
- EA-GROWTH: High quality low dd EA using trend grids. Download EA_GROWTHJoin Our Telegram Group
")


