The UK Retail Sales for July have fallen by 1.2% compared to the previous month, which is more than the expected decline of 0.5%.
…
This is a premium post.
[s2If !current_user_can(access_s2member_level4)]Please register for FREE REGISTER to read full post below containing analysis. In case of any error or you think you are not able to read the full post below, please email us at support#nehcap.com [lwa][/s2If] [s2If current_user_can(access_s2member_level1)]
- UK Retail Sales for July disappoint with a -1.2% MoM drop, surpassing the anticipated -0.5% decline.
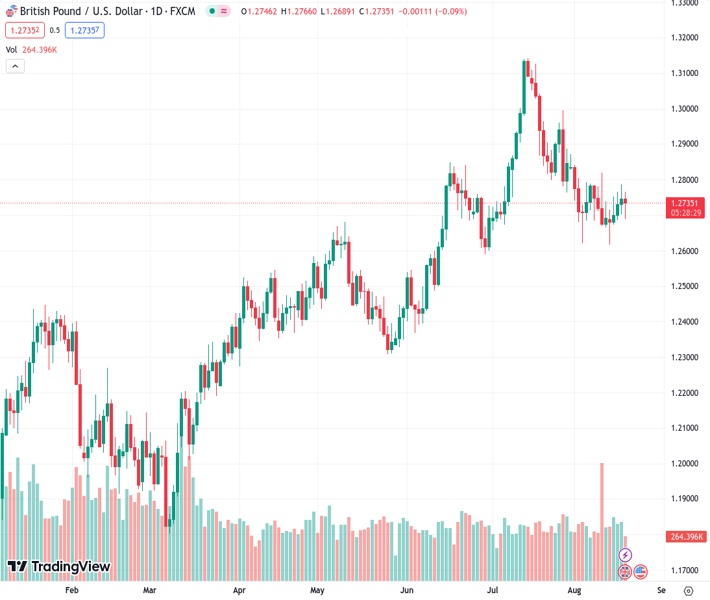
The pair currently trades last at 1.27338.
The previous day high was 1.2788 while the previous day low was 1.2703. The daily 38.2% Fib levels comes at 1.2755, expected to provide resistance. Similarly, the daily 61.8% fib level is at 1.2735, expected to provide resistance.
GBP/USD retreats from daily highs and losses for the second day in the week but remains set to finish the week on a higher note. Retail Sales in the United Kingdom (UK) were softer, but most data supports the Bank of England’s (BoE) case for a rate hike at its upcoming meeting. The GBP/USD is trading at 1.2740 after hitting a daily high of 1.2766.
Global equities post losses reflect a sour sentiment weighing on the GBP/USD’s pair as flows seeking safety bolstered the US Dollar (USD). The Office for National Statistics (ONS) revealed that Retail Sales for July plunged -1.2% MoM, below estimates for a -0.5% drop, while annually biased plummeted -3.2%, exceeding -2.1% estimates.
Nevertheless, strong readings on UK GDP and steadily high wages maintain expectations for further tightening by the BoE high, as money market players are pricing in a 6% peak on the Bank Rate. Hence, the GBP/USD would appreciate in the near term, as the interest rate differential compared to the Federal Funds Rates (FFR) in the US, currently at 5.25%-5.50%, favors the Sterling (GBP).
On the US front, the latest round of economic data keeps the greenback underpinned, and US Treasury bond yields high. Monetary policy is expected to remain at restrictive levels, as noted by Federal Reserve (Fed) officials, as July’s monetary policy minutes revealed.
The US Dollar Index (DXY), a gauge of the greenback’s value against a basket of six currencies, hovers around two-month highs at 103.680, while US Treasury bond yields pare some of its losses, with the US 10-year Treasury note yielding 4.239%, down four bps.
The UK economic docket will feature PMIs for August on its preliminary reading. On the US front, PMIs, housing data, Fed speakers, and Fed Chair Jerome Powell’s speech at the Jackson Hole Symposium are eyed for clues of the forward path of monetary policy.
The GBP/USD daily chart portrays the pair as neutral biased, though it appears bottomed at around 1.2620. Since then, the GBP/USD reclaimed 1.2700 and stood four days above the latter. Although the pair edged toward the 1.2800 figure, it was capped by the 50-day Moving Average (DMA) at 1.2786. Nevertheless, once breached, the next stop would be 1.2800, followed by August 10 at 1.2819 and the next intermediate resistance at 1.2850. Contrarily, if GBP/USD tumbles below 1.2700, that would exacerbate a fall to 1.2660.
Technical Levels: Supports and Resistances
GBPUSD currently trading at 1.2735 at the time of writing. Pair opened at 1.2747 and is trading with a change of -0.09 % .
| Overview | Overview.1 | |
|---|---|---|
| 0 | Today last price | 1.2735 |
| 1 | Today Daily Change | -0.0012 |
| 2 | Today Daily Change % | -0.0900 |
| 3 | Today daily open | 1.2747 |
The pair is trading below its 20 Daily moving average @ 1.2772, below its 50 Daily moving average @ 1.2785 , above its 100 Daily moving average @ 1.2624 and above its 200 Daily moving average @ 1.2375
| Trends | Trends.1 | |
|---|---|---|
| 0 | Daily SMA20 | 1.2772 |
| 1 | Daily SMA50 | 1.2785 |
| 2 | Daily SMA100 | 1.2624 |
| 3 | Daily SMA200 | 1.2375 |
The previous day high was 1.2788 while the previous day low was 1.2703. The daily 38.2% Fib levels comes at 1.2755, expected to provide resistance. Similarly, the daily 61.8% fib level is at 1.2735, expected to provide resistance.
Note the levels of interest below:
- Pivot support is noted at 1.2704, 1.2661, 1.2619
- Pivot resistance is noted at 1.2789, 1.2831, 1.2874
| Levels | Levels.1 |
|---|---|
| Previous Daily High | 1.2788 |
| Previous Daily Low | 1.2703 |
| Previous Weekly High | 1.2819 |
| Previous Weekly Low | 1.2666 |
| Previous Monthly High | 1.3142 |
| Previous Monthly Low | 1.2659 |
| Daily Fibonacci 38.2% | 1.2755 |
| Daily Fibonacci 61.8% | 1.2735 |
| Daily Pivot Point S1 | 1.2704 |
| Daily Pivot Point S2 | 1.2661 |
| Daily Pivot Point S3 | 1.2619 |
| Daily Pivot Point R1 | 1.2789 |
| Daily Pivot Point R2 | 1.2831 |
| Daily Pivot Point R3 | 1.2874 |
[/s2If]
Download Nehcap EAWe have two EAs that are operational on our LIVE accounts.
- EA-FIX: Check out the details here. Download EA-FIX . EA-FIX is a non-grid HFT scalper.
- EA-GROWTH: High quality low dd EA using trend grids. Download EA_GROWTHJoin Our Telegram Group
")


