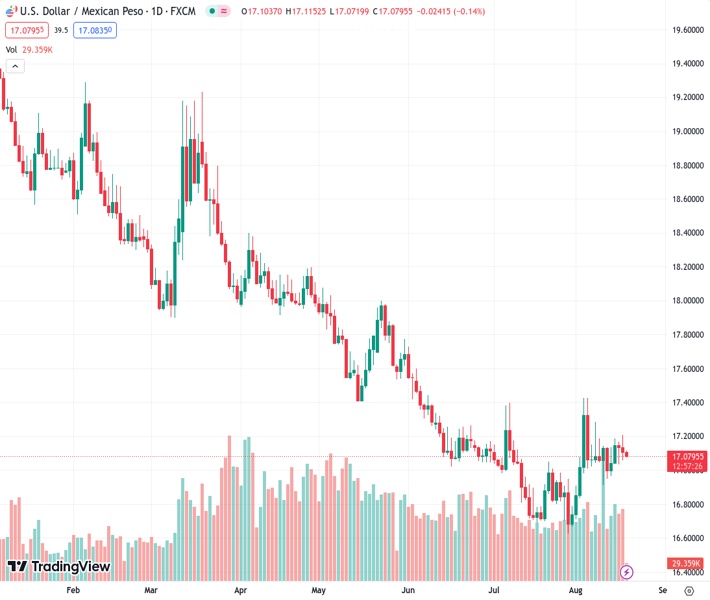
The US dollar to Mexican peso exchange rate at 17.0814 is currently uncertain with no clear direction for the day, staying within a specific range on Friday.
…
This is a premium post.
[s2If !current_user_can(access_s2member_level4)]Please register for FREE REGISTER to read full post below containing analysis. In case of any error or you think you are not able to read the full post below, please email us at support#nehcap.com [lwa][/s2If] [s2If current_user_can(access_s2member_level1)]
- USD/MXN lacks any firm intraday direction and remains confined in a range on Friday.
The pair currently trades last at 17.0814.
The previous day high was 17.2094 while the previous day low was 17.0601. The daily 38.2% Fib levels comes at 17.1171, expected to provide resistance. Similarly, the daily 61.8% fib level is at 17.1524, expected to provide resistance.
The USD/MXN pair struggles to gain any meaningful traction on Friday and oscillates in a narrow trading band through the early part of the European session. Spot prices, however, manage to defend the 17.0800-17.0850 confluence support and for now, seem to have stalled the previous day’s modest pullback from over a one-week high.
The aforementioned area comprises the 200-hour Simple Moving Average (SMA) and an ascending trend line extending from the August 10 swing low, which, in turn, should now act as a pivotal point for intraday traders. Meanwhile, technical indicators on the 1-hour chart are holding in the negative territory and support prospects for an eventual breakdown. That said, positive oscillators on 4-hour/daily charts warrant some caution before positioning for any further losses.
Hence, bearish traders are likely to wait for a sustained break and acceptance below the 17.0800-17.0850 region before placing fresh bets. The USD/MXN pair might then accelerate the slide towards the 17.0400 horizontal support en route to the 17.00 psychological mark. This is followed by last week’s swing low, around the 16.9090 area, below which spot prices could drop to the 16.8200-16.7995 area en route to the next relevant support near the 16.7030-16.7025 region.
On the flip side, the 17.1450-17.1455 region is likely to act as an immediate hurdle ahead of the weekly top, around the 17.2070 area touched on Thursday. A sustained strength beyond has the potential to lift the USD/MXN pair towards the 17.2835 zone en route to the monthly peak, around the 17.4260 region. Some follow-through buying will be seen as a fresh trigger for bullish traders and pave the way for some meaningful appreciating move in the near term.
Technical Levels: Supports and Resistances
USDMXN currently trading at 17.1098 at the time of writing. Pair opened at 17.1059 and is trading with a change of 0.02 % .
| Overview | Overview.1 | |
|---|---|---|
| 0 | Today last price | 17.1098 |
| 1 | Today Daily Change | 0.0039 |
| 2 | Today Daily Change % | 0.0200 |
| 3 | Today daily open | 17.1059 |
The pair is trading above its 20 Daily moving average @ 17.002, above its 50 Daily moving average @ 17.0329 , below its 100 Daily moving average @ 17.4402 and below its 200 Daily moving average @ 18.2028
| Trends | Trends.1 | |
|---|---|---|
| 0 | Daily SMA20 | 17.0020 |
| 1 | Daily SMA50 | 17.0329 |
| 2 | Daily SMA100 | 17.4402 |
| 3 | Daily SMA200 | 18.2028 |
The previous day high was 17.2094 while the previous day low was 17.0601. The daily 38.2% Fib levels comes at 17.1171, expected to provide resistance. Similarly, the daily 61.8% fib level is at 17.1524, expected to provide resistance.
Note the levels of interest below:
- Pivot support is noted at 17.0409, 16.9759, 16.8916
- Pivot resistance is noted at 17.1902, 17.2744, 17.3394
| Levels | Levels.1 |
|---|---|
| Previous Daily High | 17.2094 |
| Previous Daily Low | 17.0601 |
| Previous Weekly High | 17.2852 |
| Previous Weekly Low | 16.9101 |
| Previous Monthly High | 17.3957 |
| Previous Monthly Low | 16.6258 |
| Daily Fibonacci 38.2% | 17.1171 |
| Daily Fibonacci 61.8% | 17.1524 |
| Daily Pivot Point S1 | 17.0409 |
| Daily Pivot Point S2 | 16.9759 |
| Daily Pivot Point S3 | 16.8916 |
| Daily Pivot Point R1 | 17.1902 |
| Daily Pivot Point R2 | 17.2744 |
| Daily Pivot Point R3 | 17.3394 |
[/s2If]
Download Nehcap EAWe have two EAs that are operational on our LIVE accounts.
- EA-FIX: Check out the details here. Download EA-FIX . EA-FIX is a non-grid HFT scalper.
- EA-GROWTH: High quality low dd EA using trend grids. Download EA_GROWTHJoin Our Telegram Group
")


