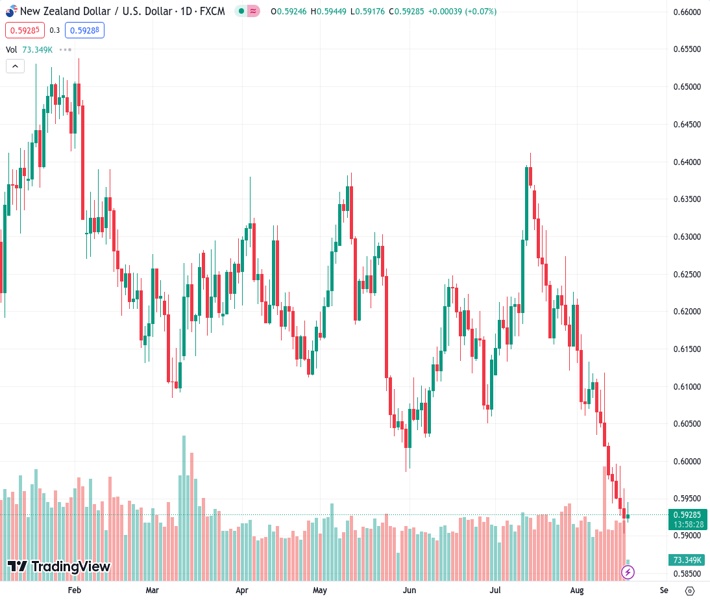
The New Zealand Dollar to US Dollar exchange rate, currently at 0.59297, has recorded its first daily increase in nine days after rebounding from its lowest level since November 2022. However, the forecast suggests that there is not much potential for further gains.
…
This is a premium post.
[s2If !current_user_can(access_s2member_level4)]Please register for FREE REGISTER to read full post below containing analysis. In case of any error or you think you are not able to read the full post below, please email us at support#nehcap.com [lwa][/s2If] [s2If current_user_can(access_s2member_level1)]
- NZD/USD prints the first daily gain in nine while bouncing off the lowest level since November 2022.
The pair currently trades last at 0.59297.
The previous day high was 0.5967 while the previous day low was 0.5903. The daily 38.2% Fib levels comes at 0.5927, expected to provide support. Similarly, the daily 61.8% fib level is at 0.5942, expected to provide resistance.
NZD/USD consolidates the weekly losses, the fourth consecutive one, amid a sluggish Friday morning as the Kiwi pair bounces the 0.5900 key support to print the first daily gain, so far, in nine. That said, the quote clings to mild gains around 0.5930 by the press time.
NZD/USD dropped to the lowest level since November the previous day amid broad US Dollar strength and fears of the no rate hike from the Reserve Bank of New Zealand (RBNZ) in near futures.
However, a convergence of the 61.8% Fibonacci retracement, also known as the Golden Fibonacci Ratio, of the Kiwi pair’s uptrend from October 2022 to February 2023, as well as a downward-sloping support line from early March, close to 0.5900, triggered the quote’s rebound.
The corrective moves also gained support from the oversold RSI and stay present despite lacking upside momentum, as portrayed by the bearish MACD signals.
It’s worth noting that a nine-month-old horizontal resistance area around 0.5880-90 restricts immediate upside of the NZD/USD pair.
Following that, a descending trend line from the mid-July joins the 50% Fibonacci retracement to highlight the 0.5925-30 resistance as the final defense of the NZD/USD bears.
Meanwhile, a downside break of the 0.5900 could quickly drag the Kiwi pair towards the early October 2022 peak surrounding 0.5815, a break of which will highlight the previous yearly bottom of 0.5511 for the NZD/USD bears.
Trend: Limited upside expected
Technical Levels: Supports and Resistances
NZDUSD currently trading at 0.593 at the time of writing. Pair opened at 0.5927 and is trading with a change of 0.05% % .
| Overview | Overview.1 | |
|---|---|---|
| 0 | Today last price | 0.593 |
| 1 | Today Daily Change | 0.0003 |
| 2 | Today Daily Change % | 0.05% |
| 3 | Today daily open | 0.5927 |
The pair remains strongly bearish on the daily time frame. It trades below the 20 SMA @ 0.6088, 50 SMA 0.6155, 100 SMA @ 0.6173 and 200 SMA @ 0.6233.
| Trends | Trends.1 | |
|---|---|---|
| 0 | Daily SMA20 | 0.6088 |
| 1 | Daily SMA50 | 0.6155 |
| 2 | Daily SMA100 | 0.6173 |
| 3 | Daily SMA200 | 0.6233 |
The previous day high was 0.5967 while the previous day low was 0.5903. The daily 38.2% Fib levels comes at 0.5927, expected to provide support. Similarly, the daily 61.8% fib level is at 0.5942, expected to provide resistance.
Note the levels of interest below:
- Pivot support is noted at 0.5898, 0.5868, 0.5834
- Pivot resistance is noted at 0.5961, 0.5996, 0.6025
| Levels | Levels.1 |
|---|---|
| Previous Daily High | 0.5967 |
| Previous Daily Low | 0.5903 |
| Previous Weekly High | 0.6118 |
| Previous Weekly Low | 0.5974 |
| Previous Monthly High | 0.6413 |
| Previous Monthly Low | 0.6120 |
| Daily Fibonacci 38.2% | 0.5927 |
| Daily Fibonacci 61.8% | 0.5942 |
| Daily Pivot Point S1 | 0.5898 |
| Daily Pivot Point S2 | 0.5868 |
| Daily Pivot Point S3 | 0.5834 |
| Daily Pivot Point R1 | 0.5961 |
| Daily Pivot Point R2 | 0.5996 |
| Daily Pivot Point R3 | 0.6025 |
[/s2If]
Download Nehcap EAWe have two EAs that are operational on our LIVE accounts.
- EA-FIX: Check out the details here. Download EA-FIX . EA-FIX is a non-grid HFT scalper.
- EA-GROWTH: High quality low dd EA using trend grids. Download EA_GROWTHJoin Our Telegram Group
")


