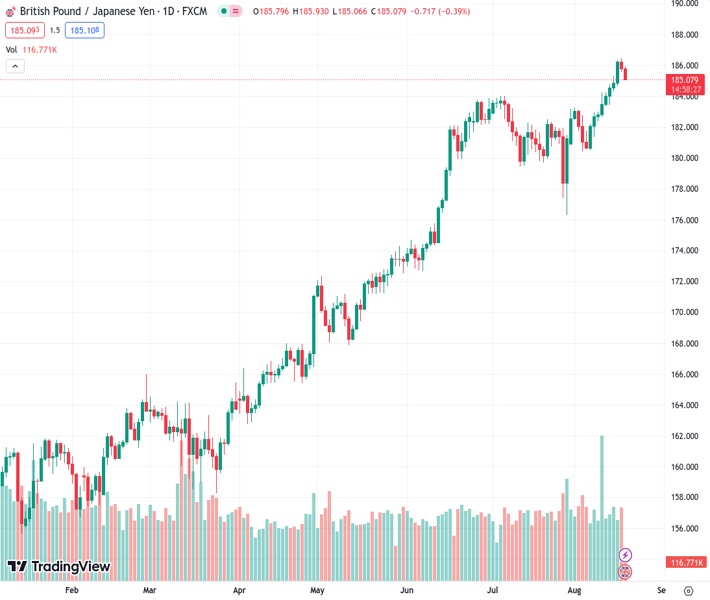
The currency pair GBPJPY is currently trading at 185.097 and it is moving back and forth within a trend channel that is sloping upwards on the one-hour chart.
…
This is a premium post.
[s2If !current_user_can(access_s2member_level4)]Please register for FREE REGISTER to read full post below containing analysis. In case of any error or you think you are not able to read the full post below, please email us at support#nehcap.com [lwa][/s2If] [s2If current_user_can(access_s2member_level1)]
- GBP/JPY cross trades within an ascending trend-channel on the one-hour chart.
The pair currently trades last at 185.097.
The previous day high was 186.47 while the previous day low was 185.57. The daily 38.2% Fib levels comes at 185.91, expected to provide resistance. Similarly, the daily 61.8% fib level is at 186.13, expected to provide resistance.
The GBP/JPY cross remains under pressure for the second consecutive day heading into the early European session on Friday. Market turn cautious amid the fear of China’s debt crisis and real-estate woes, which boost the Japanese Yen, a traditional safe-haven currency. However, the release of the UK Retail Sales could provide a clear direction for the cross.
On Thursday, Evergrande, China’s second-largest real estate company filed for bankruptcy in a US court under Chapter 15. This report fuels the fear of a potential Chinese property catastrophe. Furthermore, Fitch Ratings revealed on the same day that they might reconsider China’s A+ sovereign credit rating in the face of intensifying economic headwinds. This, in turn, exerts pressure on the Pound Sterling and acts as a headwind for GBP/JPY.
From the technical perspective, the GBP/JPY cross trades within an ascending trend-channel since August 4 on the one-hour chart. The cross stands below the 50- and 100-hour Exponential Moving Averages (EMAs) with a downward slope, which means the path of the least resistance is to the downside.
That said, a decisive break below 185.20 (the lower limit of the ascending trend-channel and 100-hour EMA) will see a drop to 184.70 (low of August 16). The next contention is located at 184.35 (high of August 14). The additional downside filter to watch is the 184.00–184.10 region, representing a psychological round figure. The key support level is located at 183.00, portraying a confluence of a high of August 8 and the round mark.
On the upside, GBP/JPY’s immediate resistance level is seen at 185.70 (50-hour EMA). Any meaningful follow-through buying will see the next stop at 186.35 (a weekly high of December 4, 2015). The critical barrier is seen at 187.00 (a round figure and a weekly high of November 27, 2015).
It’s worth noting that the Relative Strength Index (RSI) is located below 50, while the Moving Average Convergence/Divergence (MACD) stand in bearish territory. Both momentum indicators highlight that further downside cannot be ruled out.
Technical Levels: Supports and Resistances
GBPJPY currently trading at 185.22 at the time of writing. Pair opened at 185.89 and is trading with a change of -0.36 % .
| Overview | Overview.1 | |
|---|---|---|
| 0 | Today last price | 185.22 |
| 1 | Today Daily Change | -0.67 |
| 2 | Today Daily Change % | -0.36 |
| 3 | Today daily open | 185.89 |
The pair remains strongly bullish on the daily timeframe. It trades above its 20 SMA @ 182.69, 50 SMA 181.78, 100 SMA @ 175.59 and 200 SMA @ 168.97.
| Trends | Trends.1 | |
|---|---|---|
| 0 | Daily SMA20 | 182.69 |
| 1 | Daily SMA50 | 181.78 |
| 2 | Daily SMA100 | 175.59 |
| 3 | Daily SMA200 | 168.97 |
The previous day high was 186.47 while the previous day low was 185.57. The daily 38.2% Fib levels comes at 185.91, expected to provide resistance. Similarly, the daily 61.8% fib level is at 186.13, expected to provide resistance.
Note the levels of interest below:
- Pivot support is noted at 185.48, 185.07, 184.58
- Pivot resistance is noted at 186.39, 186.88, 187.29
| Levels | Levels.1 |
|---|---|
| Previous Daily High | 186.47 |
| Previous Daily Low | 185.57 |
| Previous Weekly High | 184.25 |
| Previous Weekly Low | 180.58 |
| Previous Monthly High | 184.02 |
| Previous Monthly Low | 176.32 |
| Daily Fibonacci 38.2% | 185.91 |
| Daily Fibonacci 61.8% | 186.13 |
| Daily Pivot Point S1 | 185.48 |
| Daily Pivot Point S2 | 185.07 |
| Daily Pivot Point S3 | 184.58 |
| Daily Pivot Point R1 | 186.39 |
| Daily Pivot Point R2 | 186.88 |
| Daily Pivot Point R3 | 187.29 |
[/s2If]
Download Nehcap EAWe have two EAs that are operational on our LIVE accounts.
- EA-FIX: Check out the details here. Download EA-FIX . EA-FIX is a non-grid HFT scalper.
- EA-GROWTH: High quality low dd EA using trend grids. Download EA_GROWTHJoin Our Telegram Group
")


