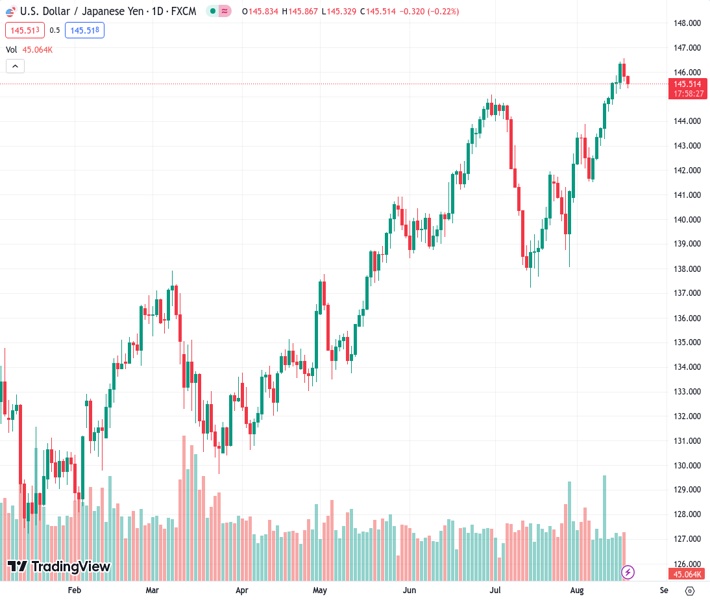
The currency pair USDJPY, trading at a value of 145.520, continues its decline from the highest point reached this year. It remains under pressure and near the lowest level of the day. According to forecasts from @nehcap, it is anticipated that there will be more downward movement.
…
This is a premium post.
[s2If !current_user_can(access_s2member_level4)]Please register for FREE REGISTER to read full post below containing analysis. In case of any error or you think you are not able to read the full post below, please email us at support#nehcap.com [lwa][/s2If] [s2If current_user_can(access_s2member_level1)]
- USD/JPY extends the previous day’s pullback from YTD high, stays pressured near intraday low of late.
The pair currently trades last at 145.520.
The previous day high was 146.56 while the previous day low was 145.62. The daily 38.2% Fib levels comes at 145.98, expected to provide resistance. Similarly, the daily 61.8% fib level is at 146.2, expected to provide resistance.
USD/JPY remains on the back foot for the second consecutive day after refreshing the Year-To-Date (YTD) high, pressured around 145.50 amid early Friday morning in Europe, as market players seek more clues amid a lackluster end of the week. Also challenging the Yen pair’s latest weakness, despite the technical confirmation, is the trader’s preparations for the next week’s top-tier central bankers’ speeches at the Jackson Hole Symposium.
That said, Japan’s upbeat prints of the National Consumer Price Index (CPI) for July join the confirmation of a three-week-old rising wedge bearish chart formation, as well as a pullback in the US Treasury bond yields to lure the USD/JPY sellers.
Also read: Japan inflation: National CPI reprints 3.3% YoY in July, USD/JPY bounces off intraday low towards 146
Furthermore, a pullback in the RSI (14) line from overbought territory joins the bearish MACD signals to keep the sellers hopeful.
However, a horizontal area comprising multiple levels marked since late June, around 145.10–144.90, challenges the immediate downside of the Yen pair.
Following that, the 200-SMA surrounding 142.00 and the 140.00 round figure will be the last defenses of the USD/JPY buyers before directing the quote toward the theoretical target of the rising wedge confirmation, near 137.50.
Alternatively, USD/JPY buyers need to defy the rising wedge formation by crossing the stated bearish pattern’s top line, close to 146.90, to retake control. Also acting as the upside filter is the 147.00 round figure.
Trend: Further downside expected
Technical Levels: Supports and Resistances
USDJPY currently trading at 145.49 at the time of writing. Pair opened at 145.84 and is trading with a change of -0.24% % .
| Overview | Overview.1 | |
|---|---|---|
| 0 | Today last price | 145.49 |
| 1 | Today Daily Change | -0.35 |
| 2 | Today Daily Change % | -0.24% |
| 3 | Today daily open | 145.84 |
The pair remains strongly bullish on the daily timeframe. It trades above its 20 SMA @ 143.05, 50 SMA 142.2, 100 SMA @ 139.06 and 200 SMA @ 136.5.
| Trends | Trends.1 | |
|---|---|---|
| 0 | Daily SMA20 | 143.05 |
| 1 | Daily SMA50 | 142.20 |
| 2 | Daily SMA100 | 139.06 |
| 3 | Daily SMA200 | 136.50 |
The previous day high was 146.56 while the previous day low was 145.62. The daily 38.2% Fib levels comes at 145.98, expected to provide resistance. Similarly, the daily 61.8% fib level is at 146.2, expected to provide resistance.
Note the levels of interest below:
- Pivot support is noted at 145.45, 145.06, 144.51
- Pivot resistance is noted at 146.39, 146.95, 147.34
| Levels | Levels.1 |
|---|---|
| Previous Daily High | 146.56 |
| Previous Daily Low | 145.62 |
| Previous Weekly High | 145.00 |
| Previous Weekly Low | 141.51 |
| Previous Monthly High | 144.91 |
| Previous Monthly Low | 137.24 |
| Daily Fibonacci 38.2% | 145.98 |
| Daily Fibonacci 61.8% | 146.20 |
| Daily Pivot Point S1 | 145.45 |
| Daily Pivot Point S2 | 145.06 |
| Daily Pivot Point S3 | 144.51 |
| Daily Pivot Point R1 | 146.39 |
| Daily Pivot Point R2 | 146.95 |
| Daily Pivot Point R3 | 147.34 |
[/s2If]
Download Nehcap EAWe have two EAs that are operational on our LIVE accounts.
- EA-FIX: Check out the details here. Download EA-FIX . EA-FIX is a non-grid HFT scalper.
- EA-GROWTH: High quality low dd EA using trend grids. Download EA_GROWTHJoin Our Telegram Group
")


