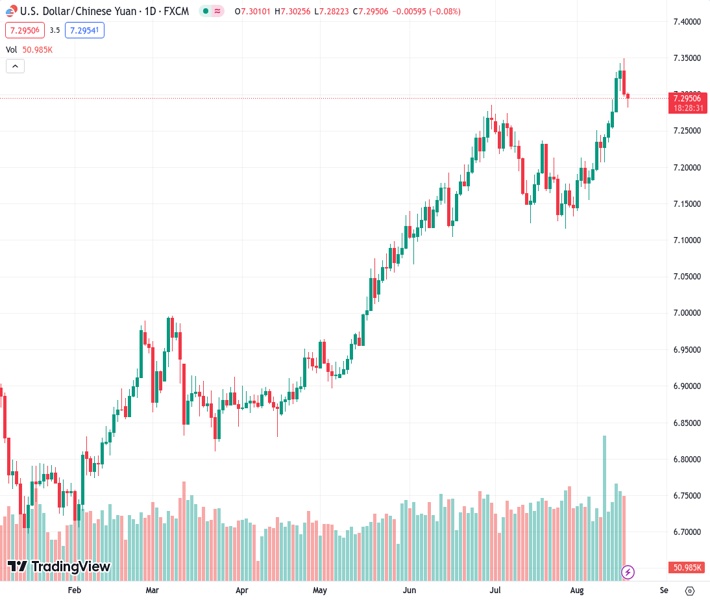
The USDCNH is maintaining a defensive stance, as it holds back following a decline from a nine-month high reached the previous day.
…
This is a premium post.
[s2If !current_user_can(access_s2member_level4)]Please register for FREE REGISTER to read full post below containing analysis. In case of any error or you think you are not able to read the full post below, please email us at support#nehcap.com [lwa][/s2If] [s2If current_user_can(access_s2member_level1)]
- USD/CNH stays defensive while keeping the previous day’s retreat from nine-month high.
The pair currently trades last at 7.29406.
The previous day high was 7.3496 while the previous day low was 7.297. The daily 38.2% Fib levels comes at 7.3171, expected to provide resistance. Similarly, the daily 61.8% fib level is at 7.3295, expected to provide resistance.
USD/CNH struggles to keep bears on the throne amid Friday’s sluggish trading, despite wading through the bullish bias by reversing from the yearly high the previous day. That said, the offshore Chinese Yuan (CNH) pares intraday losses, the second one in the row, to around 7.2900 by the press time.
That said, a pullback in the yields joins the Chinese policymakers’ readiness for more stimulus to defend the Yuan buyers even as looming fears of China’s economic slowdown and firmer US data put a floor under the USD/CNH price.
Having jumped to the highest level since 2007, the US 10-year Treasury bond yields eased around five basis points (bps) in the last hour to 4.25% as market players brace for the next week’s top-tier central bankers’ speeches at the Jackson Hole Symposium amid a light calendar.
Elsewhere, the People’s Bank of China (PBOC) released its second-quarter monetary policy report and said it “will resolutely prevent over-adjustment risks of Yuan exchange rate.” The PBoC has been defending the Yuan for a long, despite higher market pricing and finally takes advantage of the recently softer yields to favor the USD/CNH bears.
Even so, China’s second-large realtor, as well as the world’s most heavily indebted property developer, Evergrande filed for protection from creditors in a US bankruptcy court on Thursday, per Reuters, which in turn propelled the market’s fears. The same escalates woes surrounding the world’s second-largest economy, as well as the global economic transition, as it battles with the slowing economic recovery and fuels concerns about the financial health of China’s biggest realtor, namely Country Garden. Amid these fears, top-tier US banks like JP Morgan and Barclays have recently cut China growth forecasts.
On the other hand, firmer United States statistics and the hawkish Fed Minutes could be linked to a shift in the market’s dovish bias about the US central bank. Talking about the data, US Philadelphia Fed Manufacturing Survey marked the strongest print since April 2022, as well as the first positive outcome in a year, while rising to 12.0 for August from -13.5 prior and -10.0 expected. On the same line, the US Initial Jobless Claims also edged lower to 239K for the week ended on August 11 versus a revised up 250K prior and the market expectations of 240K. It should be noted that the four-week average of the Initial Jobless Claims and the weekly figures of the Continuing Claims for the period ended on August 04 edged higher. Earlier in the week, the US Industrial Production and Retail Sales for July marked surprising growth but the housing numbers were mixed.
On the other hand, the latest Fed Minutes showed that most policymakers preferred supporting the battle again the ‘sticky’ inflation, despite being divided on the imminent rate hike, which in turn challenges the market’s previous policy pivot concerns about the US central bank and favors the Greenback. Even so, the CME’s FedWatch Tool signals a nearly 86% chance of the Fed’s no rate hike in September and prods the US Dollar bulls, which in turn allows the Gold bears to take a breather.
Looking ahead, a light calendar may allow the traders to pare weekly moves while keeping eye on the risk catalysts for clear directions.
A daily closing beneath a three-week-old rising support line, around 7.2620 by the press time, becomes necessary for the USD/CNH bears to retake control.
Technical Levels: Supports and Resistances
USDCNH currently trading at 7.2896 at the time of writing. Pair opened at 7.3026 and is trading with a change of -0.18% % .
| Overview | Overview.1 | |
|---|---|---|
| 0 | Today last price | 7.2896 |
| 1 | Today Daily Change | -0.0130 |
| 2 | Today Daily Change % | -0.18% |
| 3 | Today daily open | 7.3026 |
The pair remains strongly bullish on the daily timeframe. It trades above its 20 SMA @ 7.2152, 50 SMA 7.2062, 100 SMA @ 7.0886 and 200 SMA @ 7.0025.
| Trends | Trends.1 | |
|---|---|---|
| 0 | Daily SMA20 | 7.2152 |
| 1 | Daily SMA50 | 7.2062 |
| 2 | Daily SMA100 | 7.0886 |
| 3 | Daily SMA200 | 7.0025 |
The previous day high was 7.3496 while the previous day low was 7.297. The daily 38.2% Fib levels comes at 7.3171, expected to provide resistance. Similarly, the daily 61.8% fib level is at 7.3295, expected to provide resistance.
Note the levels of interest below:
- Pivot support is noted at 7.2832, 7.2637, 7.2305
- Pivot resistance is noted at 7.3359, 7.3691, 7.3886
| Levels | Levels.1 |
|---|---|
| Previous Daily High | 7.3496 |
| Previous Daily Low | 7.2970 |
| Previous Weekly High | 7.2634 |
| Previous Weekly Low | 7.1824 |
| Previous Monthly High | 7.2744 |
| Previous Monthly Low | 7.1160 |
| Daily Fibonacci 38.2% | 7.3171 |
| Daily Fibonacci 61.8% | 7.3295 |
| Daily Pivot Point S1 | 7.2832 |
| Daily Pivot Point S2 | 7.2637 |
| Daily Pivot Point S3 | 7.2305 |
| Daily Pivot Point R1 | 7.3359 |
| Daily Pivot Point R2 | 7.3691 |
| Daily Pivot Point R3 | 7.3886 |
[/s2If]
Download Nehcap EAWe have two EAs that are operational on our LIVE accounts.
- EA-FIX: Check out the details here. Download EA-FIX . EA-FIX is a non-grid HFT scalper.
- EA-GROWTH: High quality low dd EA using trend grids. Download EA_GROWTHJoin Our Telegram Group
")


