During the Asian session on Friday, the USDCAD pair traded within a narrow range.
…
This is a premium post.
[s2If !current_user_can(access_s2member_level4)]Please register for FREE REGISTER to read full post below containing analysis. In case of any error or you think you are not able to read the full post below, please email us at support#nehcap.com [lwa][/s2If] [s2If current_user_can(access_s2member_level1)]
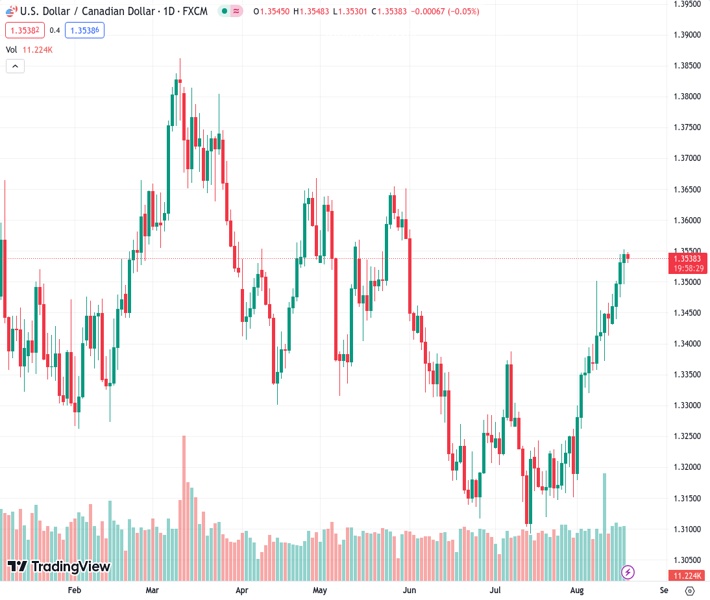
- USD/CAD oscillates in a narrow trading band during the Asian session on Friday.
The pair currently trades last at 1.35382.
The previous day high was 1.3553 while the previous day low was 1.3496. The daily 38.2% Fib levels comes at 1.3531, expected to provide support. Similarly, the daily 61.8% fib level is at 1.3518, expected to provide support.
The USD/CAD pair enters a bullish consolidation phase during the Asian session on Friday and oscillates in a narrow trading band just below mid-1.3500s, or its highest level since June 1 touched the previous day.
The US Treasury bond yields pullback after hitting a multi-year peak on Thursday, which holds back the US Dollar (USD) bulls from placing fresh bets and acts as a headwind for the USD/CAD pair. That said, growing acceptance that the Federal Reserve (Fed) will keep interest rates higher for longer should limit any meaningful downside for the US bond yields and the USD. In fact, the July 25-26 FOMC policy meeting released on Wednesday revealed that policymakers continued to prioritize the battle against inflation, though were divided over the need for more rate hikes.
Moreover, the incoming US macro data pointed to an extremely resilient economy and support prospects for further policy tightening by the Fed. Apart from this, the prevalent risk-off environment further lends support to the safe-haven Greenback and the USD/CAD pair. China’s second-large realtor – Evergrande – and Tianji Holdings – a related company – filed for protection from creditors in a US bankruptcy court on Thursday. This adds to worries about the worsening economic conditions in China and leads to a further decline in the global equity markets.
Adding to this, worries that headwinds stemming from rapidly rising borrowing costs will dent demand fail to assist Crude Oil prices to capitalize on the overnight recovery from a two-week low. This, in turn, is seen undermining the commodity-linked Loonie and suggests that the path of least resistance for the USD/CAD pair is to the upside. Hence, any meaningful corrective decline might still be seen as a buying opportunity and is likely to remain limited in the absence of any relevant market-moving economic data, either from the US or Canada.
Technical Levels: Supports and Resistances
USDCAD currently trading at 1.3546 at the time of writing. Pair opened at 1.3545 and is trading with a change of 0.01 % .
| Overview | Overview.1 | |
|---|---|---|
| 0 | Today last price | 1.3546 |
| 1 | Today Daily Change | 0.0001 |
| 2 | Today Daily Change % | 0.0100 |
| 3 | Today daily open | 1.3545 |
The pair remains strongly bullish on the daily timeframe. It trades above its 20 SMA @ 1.3347, 50 SMA 1.3278, 100 SMA @ 1.3384 and 200 SMA @ 1.3452.
| Trends | Trends.1 | |
|---|---|---|
| 0 | Daily SMA20 | 1.3347 |
| 1 | Daily SMA50 | 1.3278 |
| 2 | Daily SMA100 | 1.3384 |
| 3 | Daily SMA200 | 1.3452 |
The previous day high was 1.3553 while the previous day low was 1.3496. The daily 38.2% Fib levels comes at 1.3531, expected to provide support. Similarly, the daily 61.8% fib level is at 1.3518, expected to provide support.
Note the levels of interest below:
- Pivot support is noted at 1.351, 1.3475, 1.3454
- Pivot resistance is noted at 1.3567, 1.3588, 1.3623
| Levels | Levels.1 |
|---|---|
| Previous Daily High | 1.3553 |
| Previous Daily Low | 1.3496 |
| Previous Weekly High | 1.3502 |
| Previous Weekly Low | 1.3356 |
| Previous Monthly High | 1.3387 |
| Previous Monthly Low | 1.3093 |
| Daily Fibonacci 38.2% | 1.3531 |
| Daily Fibonacci 61.8% | 1.3518 |
| Daily Pivot Point S1 | 1.3510 |
| Daily Pivot Point S2 | 1.3475 |
| Daily Pivot Point S3 | 1.3454 |
| Daily Pivot Point R1 | 1.3567 |
| Daily Pivot Point R2 | 1.3588 |
| Daily Pivot Point R3 | 1.3623 |
[/s2If]
Download Nehcap EAWe have two EAs that are operational on our LIVE accounts.
- EA-FIX: Check out the details here. Download EA-FIX . EA-FIX is a non-grid HFT scalper.
- EA-GROWTH: High quality low dd EA using trend grids. Download EA_GROWTHJoin Our Telegram Group


