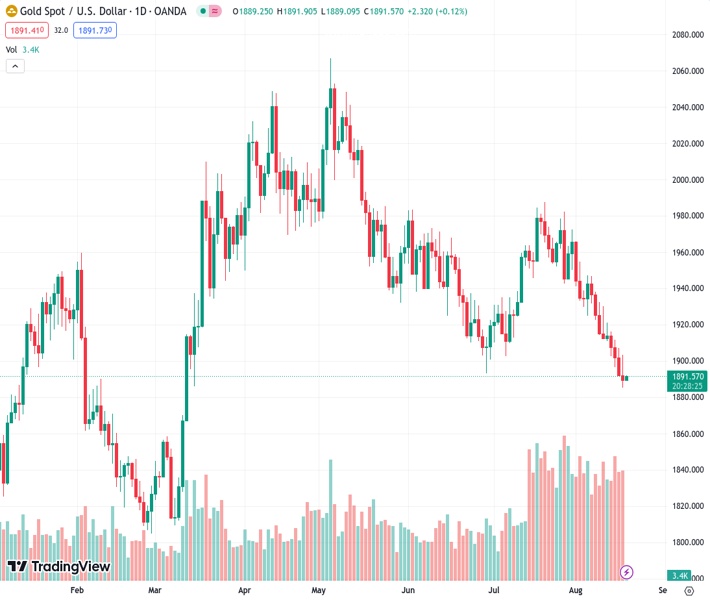
The price of gold, currently at 1,891.71 for the XAUUSD pair, has reached a stable point after hitting a five-month low. Despite a recent temporary increase, it is anticipated that the price will continue to decline for the fourth consecutive week. This outlook aligns with the perspective of @nehcap.
…
This is a premium post.
[s2If !current_user_can(access_s2member_level4)]Please register for FREE REGISTER to read full post below containing analysis. In case of any error or you think you are not able to read the full post below, please email us at support#nehcap.com [lwa][/s2If] [s2If current_user_can(access_s2member_level1)]
- Gold Price stabilizes at five-month low, braces for fourth consecutive weekly fall despite latest corrective bounce.
The pair currently trades last at 1891.71.
The previous day high was 1903.61 while the previous day low was 1885.13. The daily 38.2% Fib levels comes at 1892.19, expected to provide resistance. Similarly, the daily 61.8% fib level is at 1896.55, expected to provide resistance.
Gold Price (XAU/USD) prints mild gains around $1,891 as it consolidates the consecutive fourth weekly loss at the lowest level in five months amid early Friday in Asia. In doing so, the XAU/USD justifies the US Dollar’s latest retreat but stays on the bear’s radar amid a broad risk aversion wave and the firmer United States Treasury bond yields., especially amid China woes.
Gold Price portrays a corrective bounce from the multi-day low as the US Dollar Index (DXY) retreats from the highest level in two months to 103.40 at the latest. The Greenback’s latest retreat fails to supersede the recent doubts about the US Federal Reserve’s (Fed) policy pivot concerns which previously drowned the US Dollar and favored the Gold buyers.
That said, the recently firmer United States statistics and the hawkish Fed Minutes could be linked to a shift in the market’s dovish bias about the US central bank. On Thursday, US Philadelphia Fed Manufacturing Survey marked the strongest print since April 2022, as well as the first positive outcome in a year, while rising to 12.0 for August from -13.5 prior and -10.0 expected. On the same line, the US Initial Jobless Claims also edged lower to 239K for the week ended on August 11 versus a revised up 250K prior and the market expectations of 240K. It should be noted that the four-week average of the Initial Jobless Claims and the weekly figures of the Continuing Claims for the period ended on August 04 edged higher. Earlier in the week, the US Industrial Production and Retail Sales for July marked surprising growth but the housing numbers were mixed.
Additionally, the latest Fed Minutes showed that most policymakers preferred supporting the battle again the ‘sticky’ inflation, despite being divided on the imminent rate hike, which in turn challenges the market’s previous policy pivot concerns about the US central bank and favors the Greenback.
Even so, the CME’s FedWatch Tool signals a nearly 86% chance of the Fed’s no rate hike in September and prods the US Dollar bulls, which in turn allows the Gold bears to take a breather.
Elsewhere, downbeat concerns about the world’s biggest Gold customer China also exert downside pressure on the XAU/USD. Recently, China’s second-large realtor, as well as the world’s most heavily indebted property developer, Evergrande filed for protection from creditors in a US bankruptcy court on Thursday, per Reuters. The same escalate fears surrounding the world’s second-largest economy, as well as the global economic transition, as it battles with the slowing economic recovery and fuels concerns about the financial health of China’s biggest realtor, namely Country Garden. Amid these fears, top-tier US banks like JP Morgan and Barclays have recently cut China growth forecasts and challenged the XAU/USD buyers indirectly.
Against this backdrop, Wall Street again closed in the red and the US 10-year Treasury bond yields march toward the levels marked in 2007. It should be noted that such high levels of yields previously triggered fears of global recession and drowned the riskier assets like equities and commodities previously. That said, the US 10-year Treasury bond yields retreated in the last hour to 4.28% and triggered the Gold price rebound. However, the S&P500 Futures print mild losses and checks the XAU/USD recovery.
Looking ahead, a light calendar may push the Gold traders to watch for more risk catalysts for clear directions.
Gold Price stabilizes near the seven-month-old horizontal support area surrounding $1,890. In doing so, the XAU/USD justifies the downside break of the 200-DMA, as well as the bearish signals from the Moving Average Convergence and Divergence (MACD) indicator.
However, the nearly oversold conditions of the Relative Strength Index (RSI) line, placed at 14, underpins the XAU/USD’s bottom-picking, which in turn suggests a corrective bounce in prices before directing the bears toward the 6.5-month-old horizontal support zone surrounding $1,860.
That said, the Gold Price recovery appears elusive below the 200-DMA hurdle of around $1,907.
Following that, the 50-DMA and a downward-sloping trend line from early May, respectively near $1,937 and $1,957, will test the XAU/USD bulls before directing them to July’s peak of around $1,987 acts as the last defense of the Gold sellers.
Overall, the Gold Price remains bearish despite the latest consolidation around the key support.
Trend: Further downside expected
Technical Levels: Supports and Resistances
XAUUSD currently trading at 1891.22 at the time of writing. Pair opened at 1889.36 and is trading with a change of 0.10% % .
| Overview | Overview.1 | |
|---|---|---|
| 0 | Today last price | 1891.22 |
| 1 | Today Daily Change | 1.86 |
| 2 | Today Daily Change % | 0.10% |
| 3 | Today daily open | 1889.36 |
The pair remains strongly bearish on the daily time frame. It trades below the 20 SMA @ 1933.62, 50 SMA 1936.57, 100 SMA @ 1963.57 and 200 SMA @ 1906.05.
| Trends | Trends.1 | |
|---|---|---|
| 0 | Daily SMA20 | 1933.62 |
| 1 | Daily SMA50 | 1936.57 |
| 2 | Daily SMA100 | 1963.57 |
| 3 | Daily SMA200 | 1906.05 |
The previous day high was 1903.61 while the previous day low was 1885.13. The daily 38.2% Fib levels comes at 1892.19, expected to provide resistance. Similarly, the daily 61.8% fib level is at 1896.55, expected to provide resistance.
Note the levels of interest below:
- Pivot support is noted at 1881.79, 1874.22, 1863.31
- Pivot resistance is noted at 1900.27, 1911.18, 1918.75
| Levels | Levels.1 |
|---|---|
| Previous Daily High | 1903.61 |
| Previous Daily Low | 1885.13 |
| Previous Weekly High | 1946.82 |
| Previous Weekly Low | 1910.92 |
| Previous Monthly High | 1987.54 |
| Previous Monthly Low | 1902.77 |
| Daily Fibonacci 38.2% | 1892.19 |
| Daily Fibonacci 61.8% | 1896.55 |
| Daily Pivot Point S1 | 1881.79 |
| Daily Pivot Point S2 | 1874.22 |
| Daily Pivot Point S3 | 1863.31 |
| Daily Pivot Point R1 | 1900.27 |
| Daily Pivot Point R2 | 1911.18 |
| Daily Pivot Point R3 | 1918.75 |
[/s2If]
Download Nehcap EAWe have two EAs that are operational on our LIVE accounts.
- EA-FIX: Check out the details here. Download EA-FIX . EA-FIX is a non-grid HFT scalper.
- EA-GROWTH: High quality low dd EA using trend grids. Download EA_GROWTHJoin Our Telegram Group


