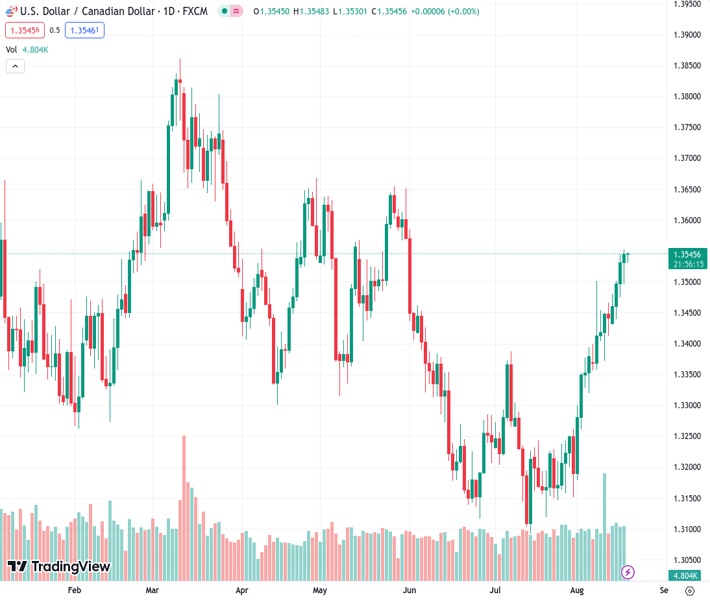
Despite worries of excessive tightening, the USDCAD pair at 1.35450 saw a boost from the unanimous decision by the Federal Reserve to raise interest rates.
…
This is a premium post.
[s2If !current_user_can(access_s2member_level4)]Please register for FREE REGISTER to read full post below containing analysis. In case of any error or you think you are not able to read the full post below, please email us at support#nehcap.com [lwa][/s2If] [s2If current_user_can(access_s2member_level1)]
- Despite concerns of overtightening, USD/CAD was buoyed by the Fed’s unanimous vote for a rate hike.
The pair currently trades last at 1.35450.
The previous day high was 1.3545 while the previous day low was 1.3475. The daily 38.2% Fib levels comes at 1.3519, expected to provide support. Similarly, the daily 61.8% fib level is at 1.3502, expected to provide support.
USD/CAD advanced to fresh two-month highs on Thursday as investors digested the US Federal Reserve’s (Fed) latest monetary policy meeting minutes, which portray board members as committed to achieving the Fed’s inflation target. Even though some board members are worried about overtightening, all the participants voted for a rate hike. The USD/CAD is trading at 1.3546, almost flat.
Wall Street finished the session with losses, while the greenback is trading almost flat, as shown by the US Dollar Index (DXY) exchanging hands at 103.437. Data from the US Bureau of Labor Statistics (BLS) reported a rise in unemployment claims last week, reaching 239K. This number was slightly below the estimated figure of 240K, indicating a resilient labor market. Simultaneously, the Philadelphia Fed disclosed its Manufacturing Index for August, which stood at 12, surpassing the anticipated -10 contraction that analysts had predicted.
On Wednesday, the Fed unveiled the minutes from its July meeting. Minutes revealed that Federal Reserve members still perceive the presence of upward risks related to inflation. This suggests that further tightening measures might be necessary. However, they also emphasized their commitment to factoring in upcoming data of the forthcoming meetings. Several regional Fed Presidents, including Bostic, Goolsbee, Harker, and Barkin, have expressed that the time has come to halt rate hikes.
In the wake of Wednesday’s data release, the Atlanta Fed GDPNow model has projected a growth rate of approximately 5.8% for the US Q3 2023 GDP. This is an increase from the 4.1% estimate recorded on August 8. Given these events, the swaps market has indicated an elevated likelihood of a 25 bps rate hike by the Federal Reserve at the impending November meeting.
Given a robust US economy, further upside is expected in the USD/CAD pair. Nevertheless, the recent inflation report in Canada can increase the odds of additional tightening by the Bank of Canada (BoC).
From a technical standpoint, the uptrend in the USD/CAD pair remains intact but is about to face solid resistance at 1.3600. A decisive break will expose the May 31 daily high of 1.3651, followed by the psychological 1.3700 mark. Conversely, if USD/CAD fails to reclaim 1.3600, the first support would be the 1.3500 mark, followed by the 200-day Moving Average (DMA) at 1.3451.
Technical Levels: Supports and Resistances
USDCAD currently trading at 1.3545 at the time of writing. Pair opened at 1.3533 and is trading with a change of 0.09 % .
| Overview | Overview.1 | |
|---|---|---|
| 0 | Today last price | 1.3545 |
| 1 | Today Daily Change | 0.0012 |
| 2 | Today Daily Change % | 0.0900 |
| 3 | Today daily open | 1.3533 |
The pair remains strongly bullish on the daily timeframe. It trades above its 20 SMA @ 1.3328, 50 SMA 1.3274, 100 SMA @ 1.3384 and 200 SMA @ 1.3451.
| Trends | Trends.1 | |
|---|---|---|
| 0 | Daily SMA20 | 1.3328 |
| 1 | Daily SMA50 | 1.3274 |
| 2 | Daily SMA100 | 1.3384 |
| 3 | Daily SMA200 | 1.3451 |
The previous day high was 1.3545 while the previous day low was 1.3475. The daily 38.2% Fib levels comes at 1.3519, expected to provide support. Similarly, the daily 61.8% fib level is at 1.3502, expected to provide support.
Note the levels of interest below:
- Pivot support is noted at 1.349, 1.3448, 1.342
- Pivot resistance is noted at 1.356, 1.3588, 1.363
| Levels | Levels.1 |
|---|---|
| Previous Daily High | 1.3545 |
| Previous Daily Low | 1.3475 |
| Previous Weekly High | 1.3502 |
| Previous Weekly Low | 1.3356 |
| Previous Monthly High | 1.3387 |
| Previous Monthly Low | 1.3093 |
| Daily Fibonacci 38.2% | 1.3519 |
| Daily Fibonacci 61.8% | 1.3502 |
| Daily Pivot Point S1 | 1.3490 |
| Daily Pivot Point S2 | 1.3448 |
| Daily Pivot Point S3 | 1.3420 |
| Daily Pivot Point R1 | 1.3560 |
| Daily Pivot Point R2 | 1.3588 |
| Daily Pivot Point R3 | 1.3630 |
[/s2If]
Download Nehcap EAWe have two EAs that are operational on our LIVE accounts.
- EA-FIX: Check out the details here. Download EA-FIX . EA-FIX is a non-grid HFT scalper.
- EA-GROWTH: High quality low dd EA using trend grids. Download EA_GROWTHJoin Our Telegram Group


