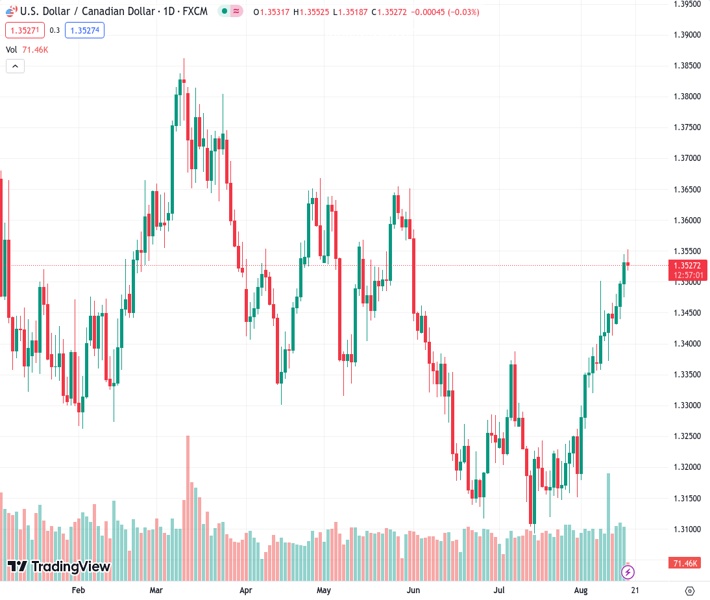
The USDCAD currency pair is retracing from its peak on Thursday, which marks its highest point since the beginning of June.
…
This is a premium post.
[s2If !current_user_can(access_s2member_level4)]Please register for FREE REGISTER to read full post below containing analysis. In case of any error or you think you are not able to read the full post below, please email us at support#nehcap.com [lwa][/s2If] [s2If current_user_can(access_s2member_level1)]
- USD/CAD pulls back from its highest level since early June touched this Thursday.
The pair currently trades last at 1.35280.
The previous day high was 1.3545 while the previous day low was 1.3475. The daily 38.2% Fib levels comes at 1.3519, expected to provide support. Similarly, the daily 61.8% fib level is at 1.3502, expected to provide support.
The USD/CAD pair retreats a few pips from the vicinity of mid-1.3500s, or the highest level since June touched this Thursday and drops to a fresh daily low during the early part of the European session. Spot prices, however, manage to hold above the 1.3500 psychological mark and seem poised to prolong the recent strong upward trajectory witnessed since the beginning of this month.
Crude Oil prices stage a modest recovery from a two-week low and for now, seem to have snapped a three-day losing streak, which, in turn, is seen underpinning the commodity-linked Loonie. The US Dollar (USD), on the other hand, eases from over a two-month peak and turns out to be another factor acting as a headwind for the USD/CAD pair. the fundamental backdrop, however, seems tilted firmly in favour of bearish traders and warrants some caution before positioning for any meaningful corrective decline.
Investors remain concerned about the worsening economic conditions in China – the world’s top Oil importer. This, along with worries that economic headwinds stemming from rapidly rising borrowing costs will dent demand, should keep a lid on any meaningful upside for the black liquid. Furthermore, firming expectations that the Federal Reserve (Fed) will keep interest rates higher for longer favour the USD bulls and further contribute to limiting the downside for the USD/CAD pair, at least for the time being.
It is worth recalling that the minutes of the July 25-26 FOMC policy meeting released on Wednesday revealed that policymakers continued to prioritize the battle against inflation, though were divided over the need for more rate hikes. Moreover, the incoming US macro data pointed to an extremely resilient economy and should allow the Fed to stick to its hawkish stance. This pushes the yield on the benchmark 10-year US government bond back closer to its highest level since 2008 touched in October 2022.
Apart from this, the prevalent risk-off environment – as depicted by a generally weaker tone around the equity markets – adds credence to the positive outlook for the safe-haven Greenback. This, in turn, suggests that the path of least resistance for the USD/CAD pair is to the upside. Traders now look to the US economic docket, featuring the release of the usual Weekly Initial Jobless Claims and the Philly Fed Manufacturing Index. The data might influence the USD price dynamics and provide some impetus to the major.
Technical Levels: Supports and Resistances
USDCAD currently trading at 1.3525 at the time of writing. Pair opened at 1.3533 and is trading with a change of -0.06 % .
| Overview | Overview.1 | |
|---|---|---|
| 0 | Today last price | 1.3525 |
| 1 | Today Daily Change | -0.0008 |
| 2 | Today Daily Change % | -0.0600 |
| 3 | Today daily open | 1.3533 |
The pair remains strongly bullish on the daily timeframe. It trades above its 20 SMA @ 1.3328, 50 SMA 1.3274, 100 SMA @ 1.3384 and 200 SMA @ 1.3451.
| Trends | Trends.1 | |
|---|---|---|
| 0 | Daily SMA20 | 1.3328 |
| 1 | Daily SMA50 | 1.3274 |
| 2 | Daily SMA100 | 1.3384 |
| 3 | Daily SMA200 | 1.3451 |
The previous day high was 1.3545 while the previous day low was 1.3475. The daily 38.2% Fib levels comes at 1.3519, expected to provide support. Similarly, the daily 61.8% fib level is at 1.3502, expected to provide support.
Note the levels of interest below:
- Pivot support is noted at 1.349, 1.3448, 1.342
- Pivot resistance is noted at 1.356, 1.3588, 1.363
| Levels | Levels.1 |
|---|---|
| Previous Daily High | 1.3545 |
| Previous Daily Low | 1.3475 |
| Previous Weekly High | 1.3502 |
| Previous Weekly Low | 1.3356 |
| Previous Monthly High | 1.3387 |
| Previous Monthly Low | 1.3093 |
| Daily Fibonacci 38.2% | 1.3519 |
| Daily Fibonacci 61.8% | 1.3502 |
| Daily Pivot Point S1 | 1.3490 |
| Daily Pivot Point S2 | 1.3448 |
| Daily Pivot Point S3 | 1.3420 |
| Daily Pivot Point R1 | 1.3560 |
| Daily Pivot Point R2 | 1.3588 |
| Daily Pivot Point R3 | 1.3630 |
[/s2If]
Download Nehcap EAWe have two EAs that are operational on our LIVE accounts.
- EA-FIX: Check out the details here. Download EA-FIX . EA-FIX is a non-grid HFT scalper.
- EA-GROWTH: High quality low dd EA using trend grids. Download EA_GROWTHJoin Our Telegram Group


