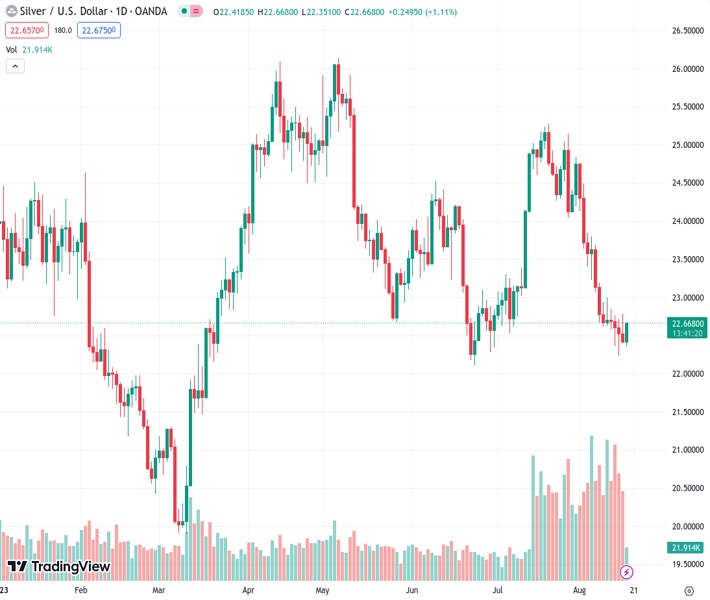
Silver regained upward momentum on Thursday and moved closer to the upper boundary of its trend-channel resistance.
…
This is a premium post.
[s2If !current_user_can(access_s2member_level4)]Please register for FREE REGISTER to read full post below containing analysis. In case of any error or you think you are not able to read the full post below, please email us at support#nehcap.com [lwa][/s2If] [s2If current_user_can(access_s2member_level1)]
- Silver regains positive traction on Thursday and climbs closer to trend-channel resistance.
The pair currently trades last at 22.642.
The previous day high was 1907.27 while the previous day low was 1891.68. The daily 38.2% Fib levels comes at 1897.64, expected to provide resistance. Similarly, the daily 61.8% fib level is at 1901.31, expected to provide resistance.
Silver attracts fresh buying near the $22.35 region on Thursday and sticks to its modest intraday gains through the early part of the European session. The white metal currently trades around the $22.60-$22.65 area, up just over 1.0% for the day, though remains well within the striking distance of a nearly two-month low touched on Tuesday.
Looking at a slightly broader picture, the XAG/USD has been drifting lower along a downward-sloping channel over the past one-and-half-week or so. The top end of the said channel, currently pegged around the $22.70 region, might continue to cap any subsequent move up beyond the 100-hour Simple Moving Average (SMA). This is followed by the 200-hour SMA, near the $22.75-$22.80 region, which if cleared decisively will set the stage for some meaningful appreciating move.
Technical indicators on the 4-hour chart, though have recovered from the bearish territory, are yet to confirm a positive bias and are still holding deep in the negative zone on the daily chart. This makes it prudent to wait for a sustained strength beyond the aforementioned barrier before confirming that the XAG/USD has formed a near-term bottom and placing fresh bets. The subsequent move up could lift the white metal beyond the $23.00 round figure, towards the $23.25 region.
The latter represents the very important 200-day SMA and should act as a pivotal point. A sustained strength beyond might trigger a fresh bout of a short-covering move and lift the XAG/USD to the $23.60-$23.65 horizontal barrier. The momentum could get extended further and allow bulls to aim to reclaim the $24.00 round figure.
On the flip side, the weekly low, around the $22.20 area, followed by the $22.10 zone, or the multi-month trough touched in June, which coincides with the trend-channel support, could protect the immediate downside ahead of the $22.00 mark. Some follow-through selling could accelerate the fall towards the $21.55-$21.50 area en route to the $21.00 round figure. The XAG/USD might then weaken the $20.60 support before dropping to the $20.00 psychological mark.
Technical Levels: Supports and Resistances
XAGUSD currently trading at 1897.42 at the time of writing. Pair opened at 1891.76 and is trading with a change of 0.3 % .
| Overview | Overview.1 | |
|---|---|---|
| 0 | Today last price | 1897.42 |
| 1 | Today Daily Change | 5.66 |
| 2 | Today Daily Change % | 0.30 |
| 3 | Today daily open | 1891.76 |
The pair remains strongly bearish on the daily time frame. It trades below the 20 SMA @ 1937.62, 50 SMA 1938.09, 100 SMA @ 1964.32 and 200 SMA @ 1905.12.
| Trends | Trends.1 | |
|---|---|---|
| 0 | Daily SMA20 | 1937.62 |
| 1 | Daily SMA50 | 1938.09 |
| 2 | Daily SMA100 | 1964.32 |
| 3 | Daily SMA200 | 1905.12 |
The previous day high was 1907.27 while the previous day low was 1891.68. The daily 38.2% Fib levels comes at 1897.64, expected to provide resistance. Similarly, the daily 61.8% fib level is at 1901.31, expected to provide resistance.
Note the levels of interest below:
- Pivot support is noted at 1886.54, 1881.31, 1870.95
- Pivot resistance is noted at 1902.13, 1912.49, 1917.72
| Levels | Levels.1 |
|---|---|
| Previous Daily High | 1907.27 |
| Previous Daily Low | 1891.68 |
| Previous Weekly High | 1946.82 |
| Previous Weekly Low | 1910.92 |
| Previous Monthly High | 1987.54 |
| Previous Monthly Low | 1902.77 |
| Daily Fibonacci 38.2% | 1897.64 |
| Daily Fibonacci 61.8% | 1901.31 |
| Daily Pivot Point S1 | 1886.54 |
| Daily Pivot Point S2 | 1881.31 |
| Daily Pivot Point S3 | 1870.95 |
| Daily Pivot Point R1 | 1902.13 |
| Daily Pivot Point R2 | 1912.49 |
| Daily Pivot Point R3 | 1917.72 |
[/s2If]
Download Nehcap EAWe have two EAs that are operational on our LIVE accounts.
- EA-FIX: Check out the details here. Download EA-FIX . EA-FIX is a non-grid HFT scalper.
- EA-GROWTH: High quality low dd EA using trend grids. Download EA_GROWTHJoin Our Telegram Group


