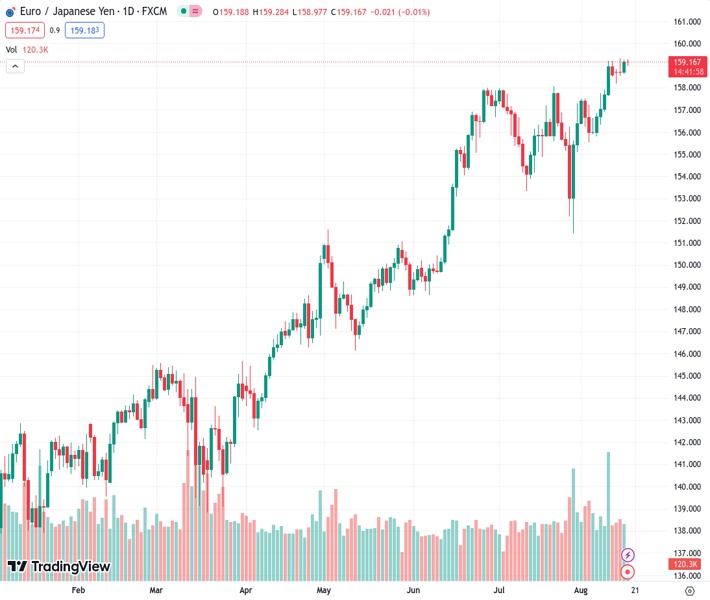
The EURJPY currency pair, at a rate of 159.136, ends a three-day period of gains but fails to maintain momentum.
…
This is a premium post.
[s2If !current_user_can(access_s2member_level4)]Please register for FREE REGISTER to read full post below containing analysis. In case of any error or you think you are not able to read the full post below, please email us at support#nehcap.com [lwa][/s2If] [s2If current_user_can(access_s2member_level1)]
- EUR/JPY snaps three-day winning streak but lacks follow-through.
The pair currently trades last at 159.136.
The previous day high was 159.26 while the previous day low was 158.64. The daily 38.2% Fib levels comes at 159.02, expected to provide support. Similarly, the daily 61.8% fib level is at 158.87, expected to provide support.
EUR/JPY clings to mild losses around the intraday low of 159.03 as it prints the first daily fall in four heading into Thursday’s European session. In doing so, the cross-currency pair fails to justify the firmer Treasury bond yields amid fears of the Japanese intervention to defend the Yen, as well as chatters that Germany can continue weighing on the Eurozone’s economic optimism.
That said, the US 10-year Treasury bond yields remain firmer at the highest level since October 2022 marked earlier in the day, around 4.29% by the press time. It should be noted that such a high level of bond coupons triggered fears of economic slowdown and drowned the riskier assets, while also underpinning the US Dollar, during late 2022.
On the other hand, global rating agency Fitch Ratings lowered medium-term Gross Domestic Product (GDP) projections for 10 developed economies, including Germany, in its quarterly Global Economic Outlook published Wednesday.
Additionally, mixed EU data also prod the EUR/JPY buyers amid looming concerns that the Japanese policymakers stand ready to intervene in the money markets to defend the Yen. On Wednesday, Eurozone Industrial Production for June marked an unexpected growth of 0.5% MoM versus -0.1% market forecasts and 0.0% previous readings. On the same line, the yearly Industrial Output figures improved to -1.2% YoY from -2.5% marked in May, versus -4.2% anticipated. Further, the second readings of the Eurozone Gross Domestic Product (GDP) for the second quarter (Q2) confirmed the 0.3% QoQ and 0.6% YoY initial estimations but the first readings of the Employment Change eased for the said period.
On the other hand, Japan marked the mixed prints of Merchandise Trade Balance for July and upbeat Machinery Orders for June, which in turn defends the Bank of Japan (BoJ) officials’ support for the ultra-easy monetary policy. Additionally, Japan’s Tertiary Industry Index for June drops to -0.4% MoM versus 1.2% prior.
Elsewhere, hawkish Fed concerns join fears of China’s slower economic recovery to also weigh on the sentiment and prod the EUR/JPY pair’s upside, via the risk-off mood. While portraying the sentiment, S&P500 Futures dropped to the lowest level in five weeks whereas the Eurostoxx 50 Futures also remain depressed at the latest.
Looking ahead, Eurozone Trade Balance for June will act as the immediate catalyst but the risk factors will be crucial for a clear guide.
Bearish RSI divergence on the daily chart suggests a pullback in the EUR/JPY price towards the seven-week-old resistance-turned-support area surrounding 158.00–15.
Technical Levels: Supports and Resistances
EURJPY currently trading at 159.05 at the time of writing. Pair opened at 159.21 and is trading with a change of -0.10% % .
| Overview | Overview.1 | |
|---|---|---|
| 0 | Today last price | 159.05 |
| 1 | Today Daily Change | -0.16 |
| 2 | Today Daily Change % | -0.10% |
| 3 | Today daily open | 159.21 |
The pair remains strongly bullish on the daily timeframe. It trades above its 20 SMA @ 156.95, 50 SMA 155.89, 100 SMA @ 151.86 and 200 SMA @ 147.2.
| Trends | Trends.1 | |
|---|---|---|
| 0 | Daily SMA20 | 156.95 |
| 1 | Daily SMA50 | 155.89 |
| 2 | Daily SMA100 | 151.86 |
| 3 | Daily SMA200 | 147.20 |
The previous day high was 159.26 while the previous day low was 158.64. The daily 38.2% Fib levels comes at 159.02, expected to provide support. Similarly, the daily 61.8% fib level is at 158.87, expected to provide support.
Note the levels of interest below:
- Pivot support is noted at 158.81, 158.41, 158.19
- Pivot resistance is noted at 159.43, 159.66, 160.06
| Levels | Levels.1 |
|---|---|
| Previous Daily High | 159.26 |
| Previous Daily Low | 158.64 |
| Previous Weekly High | 159.22 |
| Previous Weekly Low | 155.81 |
| Previous Monthly High | 158.05 |
| Previous Monthly Low | 151.41 |
| Daily Fibonacci 38.2% | 159.02 |
| Daily Fibonacci 61.8% | 158.87 |
| Daily Pivot Point S1 | 158.81 |
| Daily Pivot Point S2 | 158.41 |
| Daily Pivot Point S3 | 158.19 |
| Daily Pivot Point R1 | 159.43 |
| Daily Pivot Point R2 | 159.66 |
| Daily Pivot Point R3 | 160.06 |
[/s2If]
Download Nehcap EAWe have two EAs that are operational on our LIVE accounts.
- EA-FIX: Check out the details here. Download EA-FIX . EA-FIX is a non-grid HFT scalper.
- EA-GROWTH: High quality low dd EA using trend grids. Download EA_GROWTHJoin Our Telegram Group


