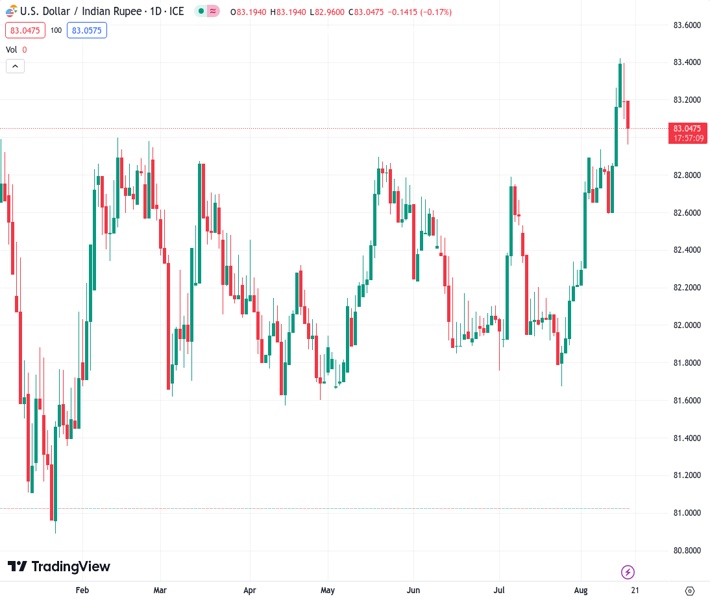
On Thursday, there was some selling pressure for the USDINR currency pair at 83.0553, causing it to decline even more from its previous all-time high.
…
This is a premium post.
[s2If !current_user_can(access_s2member_level4)]Please register for FREE REGISTER to read full post below containing analysis. In case of any error or you think you are not able to read the full post below, please email us at support#nehcap.com [lwa][/s2If] [s2If current_user_can(access_s2member_level1)]
- USD/INR meets with some supply on Thursday and retreats further from the record high.
The pair currently trades last at 83.0553.
The previous day high was 85.0306 while the previous day low was 83.0054. The daily 38.2% Fib levels comes at 83.779, expected to provide resistance. Similarly, the daily 61.8% fib level is at 84.257, expected to provide resistance.
The USD/INR pair edges lower during the Asian session on Thursday and moves further away from the record high touched earlier this week. Spot prices slide back to the 83.00 strong horizontal resistance breakpoint, though seems poised to prolong the recent upward trajectory witnessed over the past three weeks or so.
The minutes of the July 25-26 FOMC policy meeting signalled that a further rate hike remains in play later this year, which remains supportive of a further rise in the US Treasury bond yields and continues to underpin the US Dollar (USD). Apart from this, the prevalent risk-off environment could further benefit the safe-haven Greenback and help limit any meaningful corrective decline for the USD/INR pair, at least for the time being.
Even from a technical perspective, this week’s breakout through the 83.00 round-figure mark, which has been acting as a strong barrier since November 2022, supports prospects for a further near-term appreciating move for the USD/INR pair. Hence, any subsequent slide is likely to attract fresh buyers near the 82.80-82.75 region. This is followed by the 82.60-82.55 support, which should now act as a strong base for spot prices.
The positive outlook is reinforced by the fact that the Relative Strength Index (RSI) on the daily chart has already pulled back from the vicinity of the overbought territory. This, in turn, suggests that the path of least resistance for the USD/INR pair is to the upside. That said, bulls might now wait for some follow-through buying beyond the 83.40 area, or the record high before positioning for a move towards the 84.00 round-figure mark.
Technical Levels: Supports and Resistances
USDINR currently trading at 83.0148 at the time of writing. Pair opened at 83.2404 and is trading with a change of -0.27 % .
| Overview | Overview.1 | |
|---|---|---|
| 0 | Today last price | 83.0148 |
| 1 | Today Daily Change | -0.2256 |
| 2 | Today Daily Change % | -0.2700 |
| 3 | Today daily open | 83.2404 |
The pair remains strongly bullish on the daily timeframe. It trades above its 20 SMA @ 82.594, 50 SMA 82.3299, 100 SMA @ 82.2555 and 200 SMA @ 82.1996.
| Trends | Trends.1 | |
|---|---|---|
| 0 | Daily SMA20 | 82.5940 |
| 1 | Daily SMA50 | 82.3299 |
| 2 | Daily SMA100 | 82.2555 |
| 3 | Daily SMA200 | 82.1996 |
The previous day high was 85.0306 while the previous day low was 83.0054. The daily 38.2% Fib levels comes at 83.779, expected to provide resistance. Similarly, the daily 61.8% fib level is at 84.257, expected to provide resistance.
Note the levels of interest below:
- Pivot support is noted at 82.4871, 81.7337, 80.462
- Pivot resistance is noted at 84.5122, 85.7839, 86.5373
| Levels | Levels.1 |
|---|---|
| Previous Daily High | 85.0306 |
| Previous Daily Low | 83.0054 |
| Previous Weekly High | 83.0466 |
| Previous Weekly Low | 82.5854 |
| Previous Monthly High | 82.8334 |
| Previous Monthly Low | 81.6588 |
| Daily Fibonacci 38.2% | 83.7790 |
| Daily Fibonacci 61.8% | 84.2570 |
| Daily Pivot Point S1 | 82.4871 |
| Daily Pivot Point S2 | 81.7337 |
| Daily Pivot Point S3 | 80.4620 |
| Daily Pivot Point R1 | 84.5122 |
| Daily Pivot Point R2 | 85.7839 |
| Daily Pivot Point R3 | 86.5373 |
[/s2If]
Download Nehcap EAWe have two EAs that are operational on our LIVE accounts.
- EA-FIX: Check out the details here. Download EA-FIX . EA-FIX is a non-grid HFT scalper.
- EA-GROWTH: High quality low dd EA using trend grids. Download EA_GROWTHJoin Our Telegram Group


