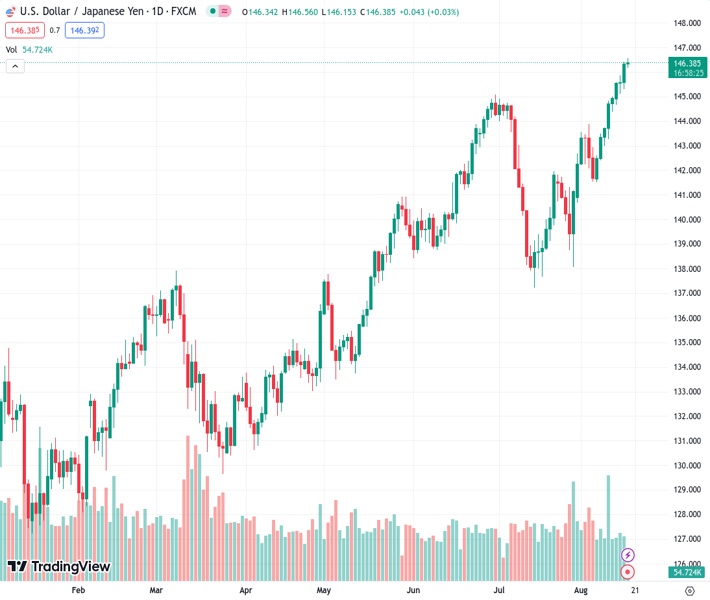
The USDJPY currency pair hovers around the highest level of the year at 146.423 due to concerns about Japan’s potential intervention and a combination of conflicting economic data from Tokyo.
…
This is a premium post.
[s2If !current_user_can(access_s2member_level4)]Please register for FREE REGISTER to read full post below containing analysis. In case of any error or you think you are not able to read the full post below, please email us at support#nehcap.com [lwa][/s2If] [s2If current_user_can(access_s2member_level1)]
- USD/JPY seesaws at YTD top amid fears of Japan intervention, mixed data from Tokyo.
The pair currently trades last at 146.423.
The previous day high was 146.41 while the previous day low was 145.31. The daily 38.2% Fib levels comes at 145.99, expected to provide support. Similarly, the daily 61.8% fib level is at 145.73, expected to provide support.
USD/JPY refreshes the Year-To-Date (YTD) high to 146.55 but lacks follow-through amid fears of the Japanese policymakers’ market intervention to defend the Yen. That said, broad risk aversion and hawkish Fed concerns underpin the major currency pair’s run-up early Thursday.
Market sentiment sours as traders fear hawkish Fed bias amid global economic woes. Also challenging the sentiment could be the geopolitical/economic woes emanating from China, as well as the recently mixed US data.
The latest Fed meeting minutes highlighted the policymakers’ discussion on the inflation pressure, despite marking a division on the rate hike decision. That said, the Minutes also conveyed that most policymakers preferred supporting the battle again the ‘sticky’ inflation. While helping the markets to justify hawkish Fed bias, US Industrial Production traced upbeat Retail Sales figures.
Additionally, a slump in China’s housing prices marked the first fall of the year in June and joins the fears about another bond market crisis in the Dragon Nation, as the biggest private realtor Country Garden struggles to pay bond payments.
To portray the mood, S&P500 Futures dropped to the lowest level in five weeks, indecisive around the multi-day bottom surrounding 4,415-20 by the press time. In doing so, the US stock futures trace losses made by the Wall Street benchmark.
It’s worth noting that, the US 10-year Treasury bond yields rise to the highest level since October 2022, around 4.298% at the latest. It should be noted that such a high level of bond coupons triggered fears of economic slowdown and drowned the riskier assets, while also underpinning the US Dollar, during late 2022.
On a different page, the mostly firmer US data and mixed Japan numbers also test the USD/JPY pair of late. Earlier in the day, Japan marked the mixed prints of Merchandise Trade Balance for July and upbeat Machinery Orders for June, which in turn defends the Bank of Japan (BoJ) officials’ support for the ultra-easy monetary policy.
Moving forward, the risk catalysts will be the key to determining the near-term AUD/JPY moves amid a light calendar elsewhere.
Overbought RSI joins ascending resistance line from July 21, close to 146.55 by the press time, to challenge USD/JPY buyers. The pullback moves, however, remain elusive beyond June’s peak of 145.05.
Technical Levels: Supports and Resistances
USDJPY currently trading at 146.39 at the time of writing. Pair opened at 146.34 and is trading with a change of 0.03% % .
| Overview | Overview.1 | |
|---|---|---|
| 0 | Today last price | 146.39 |
| 1 | Today Daily Change | 0.05 |
| 2 | Today Daily Change % | 0.03% |
| 3 | Today daily open | 146.34 |
The pair remains strongly bullish on the daily timeframe. It trades above its 20 SMA @ 142.76, 50 SMA 142.06, 100 SMA @ 138.93 and 200 SMA @ 136.47.
| Trends | Trends.1 | |
|---|---|---|
| 0 | Daily SMA20 | 142.76 |
| 1 | Daily SMA50 | 142.06 |
| 2 | Daily SMA100 | 138.93 |
| 3 | Daily SMA200 | 136.47 |
The previous day high was 146.41 while the previous day low was 145.31. The daily 38.2% Fib levels comes at 145.99, expected to provide support. Similarly, the daily 61.8% fib level is at 145.73, expected to provide support.
Note the levels of interest below:
- Pivot support is noted at 145.63, 144.92, 144.54
- Pivot resistance is noted at 146.73, 147.12, 147.83
| Levels | Levels.1 |
|---|---|
| Previous Daily High | 146.41 |
| Previous Daily Low | 145.31 |
| Previous Weekly High | 145.00 |
| Previous Weekly Low | 141.51 |
| Previous Monthly High | 144.91 |
| Previous Monthly Low | 137.24 |
| Daily Fibonacci 38.2% | 145.99 |
| Daily Fibonacci 61.8% | 145.73 |
| Daily Pivot Point S1 | 145.63 |
| Daily Pivot Point S2 | 144.92 |
| Daily Pivot Point S3 | 144.54 |
| Daily Pivot Point R1 | 146.73 |
| Daily Pivot Point R2 | 147.12 |
| Daily Pivot Point R3 | 147.83 |
[/s2If]
Download Nehcap EAWe have two EAs that are operational on our LIVE accounts.
- EA-FIX: Check out the details here. Download EA-FIX . EA-FIX is a non-grid HFT scalper.
- EA-GROWTH: High quality low dd EA using trend grids. Download EA_GROWTHJoin Our Telegram Group


