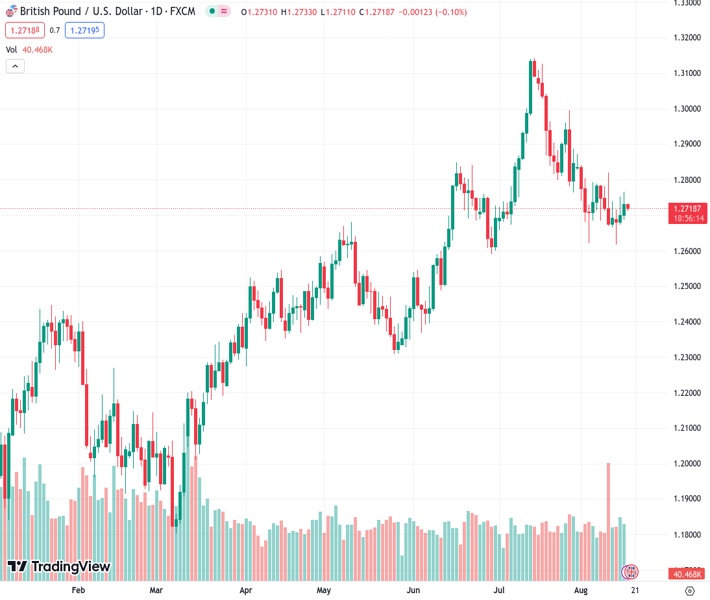
Despite the Dollar strengthening, the GBPUSD pair remains above the 1.2700 region.
…
This is a premium post.
[s2If !current_user_can(access_s2member_level4)]Please register for FREE REGISTER to read full post below containing analysis. In case of any error or you think you are not able to read the full post below, please email us at support#nehcap.com [lwa][/s2If] [s2If current_user_can(access_s2member_level1)]
- GBP/USD holds above the 1.2700 area amid a firmer Dollar.
The pair currently trades last at 1.27188.
The previous day high was 1.2766 while the previous day low was 1.2687. The daily 38.2% Fib levels comes at 1.2736, expected to provide resistance. Similarly, the daily 61.8% fib level is at 1.2717, expected to provide support.
The GBP/USD pair struggles to gain and remains well-supported above 1.2700 during the early Asian session on Thursday. The odds for a further tightening cycle from the Federal Reserve (Fed) boost the US Dollar Index above 103.50, the highest level since June. The major pair currently trades near 1.2717, losing 0.12% on the day.
On Wednesday, the UK’s National Statistics reported that the nation’s Consumer Price Index (CPI) MoM came in at -0.4%, above the market consensus of -0.5% versus the previous reading of 0.1%. On a yearly basis, British CPI inflation rose 6.8% for June, as expected of 6.8%. The core CPI, which excludes volatile oil and food prices for July, increased 6.9%, better than the 6.8% estimation. Meanwhile, the UK Retail Price Index (RPI) for July came in at -0.6% MoM and 9.0% YoY. The stronger-than-expected data from the UK might convince the Bank of England (BoE) to raise an additional rate.
Across the pond, the hawkish statement from FOMC Minutes and the upbeat US data lift the US Dollar broardly, That said, the Federal Open Market Committee (FOMC) Minutes stated that inflation remained unacceptably high. The Fed official saw significant inflationary risks, and it may need additional tightening of monetary policy to bring inflation to the longer-run target.
About the data, US Industrial Production increased 1.0% in July, beating market expectations of 0.3% and a prior decrease of 0.8%. In July, Building Permits increased from 1.44 million to 1.44 million, while Housing Starts increased from 1.39 million in June to 1.45 million, exceeding expectations of 1.48 million. Both the Change in Building Permits and the Change in Housing Starts exceeded both market expectations and prior readings. This, in turn, boosts the Greenback and acts as a headwind for the GBP/USD pair.
Looking ahead, market players will monitor the US weekly Initial Jobless Claims for the week ending August 11 and the Philadelphia Fed Manufacturing Survey for August, due later in the American session. The focus will shift to UK Retail Sales for July, due on Friday. The monthly figure is expected to drop 0.5%.
Technical Levels: Supports and Resistances
GBPUSD currently trading at 1.2714 at the time of writing. Pair opened at 1.2732 and is trading with a change of -0.14 % .
| Overview | Overview.1 | |
|---|---|---|
| 0 | Today last price | 1.2714 |
| 1 | Today Daily Change | -0.0018 |
| 2 | Today Daily Change % | -0.1400 |
| 3 | Today daily open | 1.2732 |
The pair is trading below its 20 Daily moving average @ 1.2778, below its 50 Daily moving average @ 1.2781 , above its 100 Daily moving average @ 1.2621 and above its 200 Daily moving average @ 1.2369
| Trends | Trends.1 | |
|---|---|---|
| 0 | Daily SMA20 | 1.2778 |
| 1 | Daily SMA50 | 1.2781 |
| 2 | Daily SMA100 | 1.2621 |
| 3 | Daily SMA200 | 1.2369 |
The previous day high was 1.2766 while the previous day low was 1.2687. The daily 38.2% Fib levels comes at 1.2736, expected to provide resistance. Similarly, the daily 61.8% fib level is at 1.2717, expected to provide support.
Note the levels of interest below:
- Pivot support is noted at 1.269, 1.2649, 1.2611
- Pivot resistance is noted at 1.277, 1.2808, 1.2849
| Levels | Levels.1 |
|---|---|
| Previous Daily High | 1.2766 |
| Previous Daily Low | 1.2687 |
| Previous Weekly High | 1.2819 |
| Previous Weekly Low | 1.2666 |
| Previous Monthly High | 1.3142 |
| Previous Monthly Low | 1.2659 |
| Daily Fibonacci 38.2% | 1.2736 |
| Daily Fibonacci 61.8% | 1.2717 |
| Daily Pivot Point S1 | 1.2690 |
| Daily Pivot Point S2 | 1.2649 |
| Daily Pivot Point S3 | 1.2611 |
| Daily Pivot Point R1 | 1.2770 |
| Daily Pivot Point R2 | 1.2808 |
| Daily Pivot Point R3 | 1.2849 |
[/s2If]
Download Nehcap EAWe have two EAs that are operational on our LIVE accounts.
- EA-FIX: Check out the details here. Download EA-FIX . EA-FIX is a non-grid HFT scalper.
- EA-GROWTH: High quality low dd EA using trend grids. Download EA_GROWTHJoin Our Telegram Group


