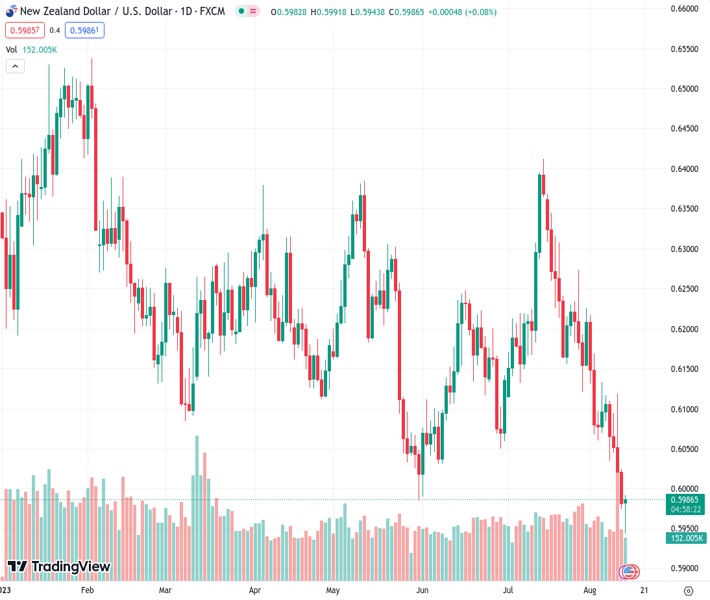
The US Dollar is being favored due to global risk aversion, amplified by China’s property crisis and weak recovery data, in the case of the NZDUSD pair at 0.59845.
…
This is a premium post.
[s2If !current_user_can(access_s2member_level4)]Please register for FREE REGISTER to read full post below containing analysis. In case of any error or you think you are not able to read the full post below, please email us at support#nehcap.com [lwa][/s2If] [s2If current_user_can(access_s2member_level1)]
- China’s property crisis and weak recovery data amplify global risk aversion, favoring the US Dollar.
The pair currently trades last at 0.59845.
The previous day high was 0.6089 while the previous day low was 0.5974. The daily 38.2% Fib levels comes at 0.6018, expected to provide resistance. Similarly, the daily 61.8% fib level is at 0.6045, expected to provide resistance.
NZD/USD posts modest gains in the North American session amid a risk aversion spurred by China’s real estate woes triggering a flight to safe-haven assets and bolstering the Greenback, which remains underpinned by high UST bond yields. The NZD/USD is trading at 0.5985, up 0.07%, after reaching a new year-to-date (YTD) low of 0.5943.
Wall Street has turned positive in the day, though the story favors the Greenback in the FX space. The latest week’s soft data from China portrays a weaker economic recovery, while its property crisis keeps investors uneasy.
US Treasury bond yields edged higher during the session, though they had pared their earlier gains, with the US 10-year Treasury bond yield sitting at 4.172%, clinging to gains of one basis point. The US Dollar Index (DXY), which measures the buck’s value against a basket of peers, gains 0.18% and stays at 103.034, with headwinds for the NZD/USD.
The US economic calendar will feature US Retail Sales, which are expected to improve compared to June’s data, while Import and Export prices are expected to increase a tick. Manufacturing activity in New York is expected to remain subdued, while Fed speakers could give some clues regarding the Fed’s forward path.
On the New Zealand front, the Reserve Bank of New Zealand (RBNZ) is expected to keep rates unchanged at 5.50%, as the NZ economy remains in a mild recession, while inflation has fallen to 6.0%, from 7.3% last year. Analysts at Kiwibank said, “The cash rate has peaked…and will remain there until the RBNZ is convinced inflation will return to the target.”
From a technical standpoint, the NZD/USD remains downward biased, reaching a new YTD low, but buyers entered the market, lifting the pair to test the prior’s YTD low of 0.5985. A daily close above the latter and the NZD/USD could regain the 0.6000 figure, with the next resistance emerging at 0.6024. Otherwise, the NZD/USD could extend towards 0.5900 before testing last year’s November 10 swing low of 0.5840.
Technical Levels: Supports and Resistances
NZDUSD currently trading at 0.5984 at the time of writing. Pair opened at 0.5984 and is trading with a change of 0.0 % .
| Overview | Overview.1 | |
|---|---|---|
| 0 | Today last price | 0.5984 |
| 1 | Today Daily Change | 0.0000 |
| 2 | Today Daily Change % | 0.0000 |
| 3 | Today daily open | 0.5984 |
The pair remains strongly bearish on the daily time frame. It trades below the 20 SMA @ 0.6153, 50 SMA 0.6164, 100 SMA @ 0.6184 and 200 SMA @ 0.6233.
| Trends | Trends.1 | |
|---|---|---|
| 0 | Daily SMA20 | 0.6153 |
| 1 | Daily SMA50 | 0.6164 |
| 2 | Daily SMA100 | 0.6184 |
| 3 | Daily SMA200 | 0.6233 |
The previous day high was 0.6089 while the previous day low was 0.5974. The daily 38.2% Fib levels comes at 0.6018, expected to provide resistance. Similarly, the daily 61.8% fib level is at 0.6045, expected to provide resistance.
Note the levels of interest below:
- Pivot support is noted at 0.5942, 0.5901, 0.5827
- Pivot resistance is noted at 0.6057, 0.613, 0.6172
| Levels | Levels.1 |
|---|---|
| Previous Daily High | 0.6089 |
| Previous Daily Low | 0.5974 |
| Previous Weekly High | 0.6118 |
| Previous Weekly Low | 0.5974 |
| Previous Monthly High | 0.6413 |
| Previous Monthly Low | 0.6120 |
| Daily Fibonacci 38.2% | 0.6018 |
| Daily Fibonacci 61.8% | 0.6045 |
| Daily Pivot Point S1 | 0.5942 |
| Daily Pivot Point S2 | 0.5901 |
| Daily Pivot Point S3 | 0.5827 |
| Daily Pivot Point R1 | 0.6057 |
| Daily Pivot Point R2 | 0.6130 |
| Daily Pivot Point R3 | 0.6172 |
[/s2If]
Download Nehcap EAWe have two EAs that are operational on our LIVE accounts.
- EA-FIX: Check out the details here. Download EA-FIX . EA-FIX is a non-grid HFT scalper.
- EA-GROWTH: High quality low dd EA using trend grids. Download EA_GROWTHJoin Our Telegram Group


