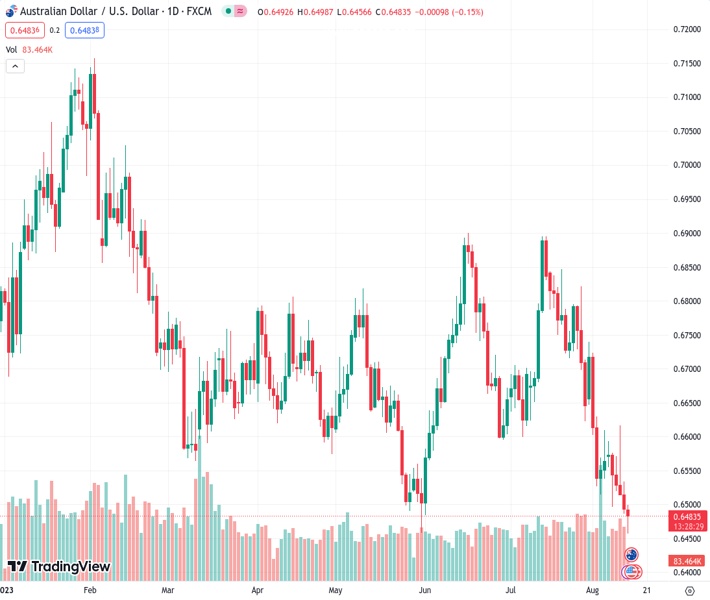
The Australian Dollar to US Dollar currency pair, with a value of 0.64835, continues to decline for the fifth consecutive day, reaching a new low for the year on Monday.
…
This is a premium post.
[s2If !current_user_can(access_s2member_level4)]Please register for FREE REGISTER to read full post below containing analysis. In case of any error or you think you are not able to read the full post below, please email us at support#nehcap.com [lwa][/s2If] [s2If current_user_can(access_s2member_level1)]
- AUD/USD drifts lower for the fifth straight day and drops to a fresh YTD low on Monday.
The pair currently trades last at 0.64835.
The previous day high was 0.6534 while the previous day low was 0.6486. The daily 38.2% Fib levels comes at 0.6504, expected to provide resistance. Similarly, the daily 61.8% fib level is at 0.6515, expected to provide resistance.
The AUD/USD pair drops to its lowest level since November 2022 on the first day of a new week, albeit manages to rebound a few pips heading into the European session. Spot prices currently trade around the 0.6480 region, still down over 0.25% for the day, and remain vulnerable to prolonging the downward trajectory witnessed over the past month or so.
The global risk sentiment takes a turn for the worst on Monday in the wake of growing concerns about the worsening economic conditions in China. The fears were amplified further after China’s Country Garden – one of the biggest developers – warned of a massive $7.6 billion loss in the first half of 2023. This, along with geopolitical risks, tempers investors’ appetite for riskier assets, which is evident from a sea of red across the Asian equity markets and turns out to be a key factor driving flows away from the risk-sensitive Australian Dollar (AUD).
In fact, a Russian warship fired warning shots at a cargo ship, which it claims was headed to Ukraine, in the southwestern Black Sea on Sunday. It is worth recalling that Russia had pulled out of a UN-brokered deal in July that allowed Ukraine to move its grain via the Black Sea and warned that any ships headed to Ukraine would be treated as potentially carrying weapons. This, along with expectations that the Federal Reserve (Fed) will keep interest rates higher for longer, boosts the safe-haven US Dollar (USD) and exerts pressure on the AUD/USD pair.
The markets seem convinced that the US central bank will stick to its hawkish stance to curb inflation and have been pricing in the possibility of one more rate hike by the end of this year. The bets were reaffirmed by US macro data released on Friday, which showed that PPI climbed slightly more than expected in July. Against the backdrop of a moderate rise in consumer prices in July, the data suggested that the battle to bring inflation back to the Fed’s 2% target is far from being won. This, in turn, keeps the door for a 25 bps lift-off in November wide open.
Hawkish Fed expectations, meanwhile, remain supportive of elevated US Treasury bond yields and continues to underpin the Greenback. That said, hopes for additional stimulus measures from China hold back traders from placing fresh bearish bets around the AUD/USD pair and help limit further losses. The fundamental backdrop, however, seems tilted firmly in favour of bearish traders and suggests that the path of least resistance for spot prices is to the downside. Hence, any subsequent recovery might still be seen as a selling opportunity and remain capped.
Technical Levels: Supports and Resistances
AUDUSD currently trading at 0.6479 at the time of writing. Pair opened at 0.6496 and is trading with a change of -0.26 % .
| Overview | Overview.1 | |
|---|---|---|
| 0 | Today last price | 0.6479 |
| 1 | Today Daily Change | -0.0017 |
| 2 | Today Daily Change % | -0.2600 |
| 3 | Today daily open | 0.6496 |
The pair remains strongly bearish on the daily time frame. It trades below the 20 SMA @ 0.666, 50 SMA 0.67, 100 SMA @ 0.6682 and 200 SMA @ 0.6737.
| Trends | Trends.1 | |
|---|---|---|
| 0 | Daily SMA20 | 0.6660 |
| 1 | Daily SMA50 | 0.6700 |
| 2 | Daily SMA100 | 0.6682 |
| 3 | Daily SMA200 | 0.6737 |
The previous day high was 0.6534 while the previous day low was 0.6486. The daily 38.2% Fib levels comes at 0.6504, expected to provide resistance. Similarly, the daily 61.8% fib level is at 0.6515, expected to provide resistance.
Note the levels of interest below:
- Pivot support is noted at 0.6477, 0.6458, 0.643
- Pivot resistance is noted at 0.6525, 0.6553, 0.6572
| Levels | Levels.1 |
|---|---|
| Previous Daily High | 0.6534 |
| Previous Daily Low | 0.6486 |
| Previous Weekly High | 0.6617 |
| Previous Weekly Low | 0.6486 |
| Previous Monthly High | 0.6895 |
| Previous Monthly Low | 0.6599 |
| Daily Fibonacci 38.2% | 0.6504 |
| Daily Fibonacci 61.8% | 0.6515 |
| Daily Pivot Point S1 | 0.6477 |
| Daily Pivot Point S2 | 0.6458 |
| Daily Pivot Point S3 | 0.6430 |
| Daily Pivot Point R1 | 0.6525 |
| Daily Pivot Point R2 | 0.6553 |
| Daily Pivot Point R3 | 0.6572 |
[/s2If]
Download Nehcap EAWe have two EAs that are operational on our LIVE accounts.
- EA-FIX: Check out the details here. Download EA-FIX . EA-FIX is a non-grid HFT scalper.
- EA-GROWTH: High quality low dd EA using trend grids. Download EA_GROWTHJoin Our Telegram Group


