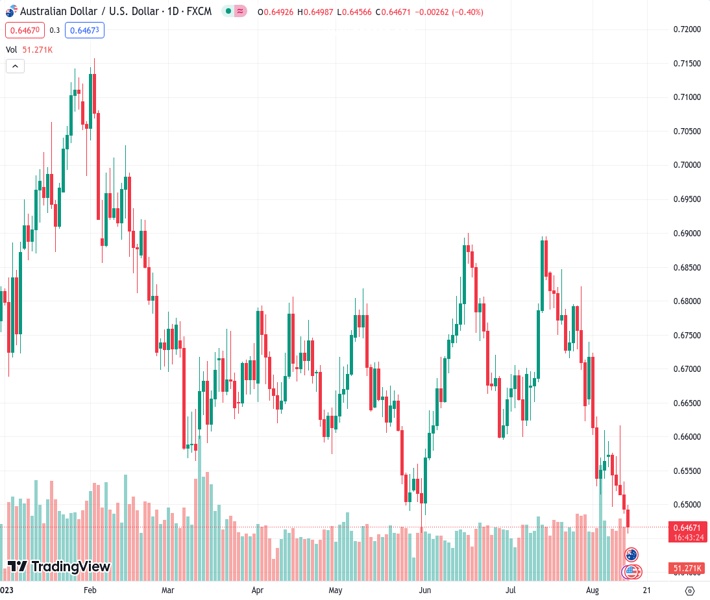
The AUDUSD currency pair continues to decline for the fifth consecutive day and reaches a new low for the year on Monday.
…
This is a premium post.
[s2If !current_user_can(access_s2member_level4)]Please register for FREE REGISTER to read full post below containing analysis. In case of any error or you think you are not able to read the full post below, please email us at support#nehcap.com [lwa][/s2If] [s2If current_user_can(access_s2member_level1)]
- AUD/USD drifts lower for the fifth successive day and drops to a fresh YTD low on Monday.
The pair currently trades last at 0.64670.
The previous day high was 0.6534 while the previous day low was 0.6486. The daily 38.2% Fib levels comes at 0.6504, expected to provide resistance. Similarly, the daily 61.8% fib level is at 0.6515, expected to provide resistance.
The AUD/USD pair continues losing ground for the fifth successive day and drops to a fresh low since November 2022, closer to mid-0.6400s during the Asian session on Monday.
The worsening economic conditions in China, along with US-China tensions and geopolitical risks, temper investors’ appetite for riskier assets and drive flows away from the risk-sensitive Australian Dollar (AUD). The US Dollar (USD), on the other hand, climbs to a multi-week top and remains well supported by growing acceptance that the Federal Reserve (Fed) will keep interest rates higher for longer. This, in turn, is seen exerting downward pressure on the AUD/USD pair and contributing to the ongoing decline.
From a technical perspective, a subsequent slide and acceptance below the 0.6500 psychological mark add credence to the recent breakdown through the bearish double-top neckline support near the 0.6600 horizontal level. This, along with the aforementioned fundamental backdrop, suggests that the path of least resistance for the AUD/USD pair is to the downside. That said, the Relative Strength Index (RSI) on the daily chart has moved on the verge of breaking into the oversold zone and warrants some caution.
Hence, it will be prudent to wait for some near-term consolidation or a modest bounce before traders start positioning for a further depreciating move. Any attempted recovery, however, is more likely to confront stiff resistance and meet with a fresh supply near the 0.6500 mark. This, in turn, should cap the AUD/USD pair near the 0.6530 area, which should now act as a pivotal point. A sustained strength beyond might trigger a short-covering rally and lift spot prices towards the 0.6600 round figure.
The latter is closely followed by last week’s swing high, around the 0.6615 region, above which the AUD/USD pair could extend the momentum further towards the 0.6700 mark, representing the 50-day Simple Moving Average (SMA), en route to the very important 200-day SMA, currently pegged around the 0.6725-0.6730 area.
The AUD/USD pair, meanwhile, seems poised to weaken further below the 0.6455-0.6450 area and eventually drop to the 0.6400 round figure. Some follow-through selling will expose the next relevant support near the 0.6365-0.6360 region and the 0.6300 mark, which if broken decisively will be seen as a fresh trigger for bearish traders and pave the way for further losses.
Technical Levels: Supports and Resistances
AUDUSD currently trading at 0.6467 at the time of writing. Pair opened at 0.6496 and is trading with a change of -0.45 % .
| Overview | Overview.1 | |
|---|---|---|
| 0 | Today last price | 0.6467 |
| 1 | Today Daily Change | -0.0029 |
| 2 | Today Daily Change % | -0.4500 |
| 3 | Today daily open | 0.6496 |
The pair remains strongly bearish on the daily time frame. It trades below the 20 SMA @ 0.666, 50 SMA 0.67, 100 SMA @ 0.6682 and 200 SMA @ 0.6737.
| Trends | Trends.1 | |
|---|---|---|
| 0 | Daily SMA20 | 0.6660 |
| 1 | Daily SMA50 | 0.6700 |
| 2 | Daily SMA100 | 0.6682 |
| 3 | Daily SMA200 | 0.6737 |
The previous day high was 0.6534 while the previous day low was 0.6486. The daily 38.2% Fib levels comes at 0.6504, expected to provide resistance. Similarly, the daily 61.8% fib level is at 0.6515, expected to provide resistance.
Note the levels of interest below:
- Pivot support is noted at 0.6477, 0.6458, 0.643
- Pivot resistance is noted at 0.6525, 0.6553, 0.6572
| Levels | Levels.1 |
|---|---|
| Previous Daily High | 0.6534 |
| Previous Daily Low | 0.6486 |
| Previous Weekly High | 0.6617 |
| Previous Weekly Low | 0.6486 |
| Previous Monthly High | 0.6895 |
| Previous Monthly Low | 0.6599 |
| Daily Fibonacci 38.2% | 0.6504 |
| Daily Fibonacci 61.8% | 0.6515 |
| Daily Pivot Point S1 | 0.6477 |
| Daily Pivot Point S2 | 0.6458 |
| Daily Pivot Point S3 | 0.6430 |
| Daily Pivot Point R1 | 0.6525 |
| Daily Pivot Point R2 | 0.6553 |
| Daily Pivot Point R3 | 0.6572 |
[/s2If]
Download Nehcap EAWe have two EAs that are operational on our LIVE accounts.
- EA-FIX: Check out the details here. Download EA-FIX . EA-FIX is a non-grid HFT scalper.
- EA-GROWTH: High quality low dd EA using trend grids. Download EA_GROWTHJoin Our Telegram Group
")


