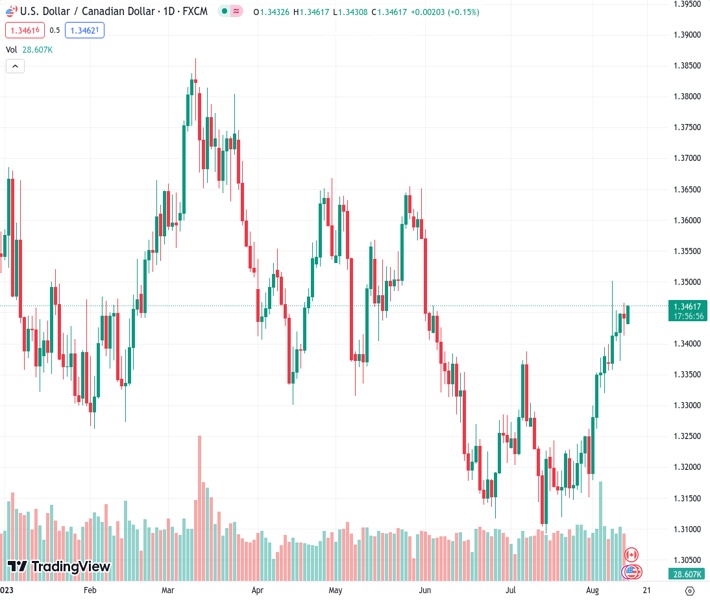
The USDCAD currency pair trades at a rate of 1.34607 and is increasing to reach the highest level of the day, while facing significant obstacles. According to the viewpoint of @nehcap, more upward movement is predicted.
…
This is a premium post.
[s2If !current_user_can(access_s2member_level4)]Please register for FREE REGISTER to read full post below containing analysis. In case of any error or you think you are not able to read the full post below, please email us at support#nehcap.com [lwa][/s2If] [s2If current_user_can(access_s2member_level1)]
- USD/CAD takes the bids to refresh intraday high, jostles with crucial resistances.
The pair currently trades last at 1.34607.
The previous day high was 1.3466 while the previous day low was 1.3412. The daily 38.2% Fib levels comes at 1.3433, expected to provide support. Similarly, the daily 61.8% fib level is at 1.3446, expected to provide support.
USD/CAD crosses the 200-DMA hurdle as bulls attack the five-month-old descending resistance line early Monday in Europe. In doing so, the Loonie pair justifies the retreat in the WTI crude oil prices, Canada’s key export item, while taking clues from the firmer US Treasury bond yields and the US Dollar amid sour sentiment. That said, the major currency pair rises 0.11% intraday to near 1.3460 by the press time.
Also read: USD/CAD holds ground near the 1.3440 mark, eyes on Canadian CPI, US Retail Sales
Apart from the aforementioned fundamentals, a successful break of the rising trend line from April 14, close to 1.3400, joins the bullish MACD signals to keep the USD/CAD buyers hopeful.
However, a daily closing beyond the stated resistance line, close to 1.3460 at the latest, becomes necessary for the Loonie pair buyers to keep the reins.
Also likely to challenge the USD/CAD buyers is the monthly high of near 1.3500, a break of which could propel the prices toward a horizontal area comprising multiple tops marked since late April, close to 1.3655–70.
On the flip side, USD/CAD sellers will seek a daily closing beneath the 200-DMA level of 1.3450 to rethink returning from the camp.
Even so, a four-month-long rising trend line near 1.3400 will test the Loonie pair’s downside before giving control to the bears.
Trend: Further upside expected
Technical Levels: Supports and Resistances
USDCAD currently trading at 1.3458 at the time of writing. Pair opened at 1.3442 and is trading with a change of 0.12% % .
| Overview | Overview.1 | |
|---|---|---|
| 0 | Today last price | 1.3458 |
| 1 | Today Daily Change | 0.0016 |
| 2 | Today Daily Change % | 0.12% |
| 3 | Today daily open | 1.3442 |
The pair remains strongly bullish on the daily timeframe. It trades above its 20 SMA @ 1.328, 50 SMA 1.3268, 100 SMA @ 1.3388 and 200 SMA @ 1.345.
| Trends | Trends.1 | |
|---|---|---|
| 0 | Daily SMA20 | 1.3280 |
| 1 | Daily SMA50 | 1.3268 |
| 2 | Daily SMA100 | 1.3388 |
| 3 | Daily SMA200 | 1.3450 |
The previous day high was 1.3466 while the previous day low was 1.3412. The daily 38.2% Fib levels comes at 1.3433, expected to provide support. Similarly, the daily 61.8% fib level is at 1.3446, expected to provide support.
Note the levels of interest below:
- Pivot support is noted at 1.3415, 1.3387, 1.3361
- Pivot resistance is noted at 1.3468, 1.3494, 1.3522
| Levels | Levels.1 |
|---|---|
| Previous Daily High | 1.3466 |
| Previous Daily Low | 1.3412 |
| Previous Weekly High | 1.3502 |
| Previous Weekly Low | 1.3356 |
| Previous Monthly High | 1.3387 |
| Previous Monthly Low | 1.3093 |
| Daily Fibonacci 38.2% | 1.3433 |
| Daily Fibonacci 61.8% | 1.3446 |
| Daily Pivot Point S1 | 1.3415 |
| Daily Pivot Point S2 | 1.3387 |
| Daily Pivot Point S3 | 1.3361 |
| Daily Pivot Point R1 | 1.3468 |
| Daily Pivot Point R2 | 1.3494 |
| Daily Pivot Point R3 | 1.3522 |
[/s2If]
Download Nehcap EAWe have two EAs that are operational on our LIVE accounts.
- EA-FIX: Check out the details here. Download EA-FIX . EA-FIX is a non-grid HFT scalper.
- EA-GROWTH: High quality low dd EA using trend grids. Download EA_GROWTHJoin Our Telegram Group
")


