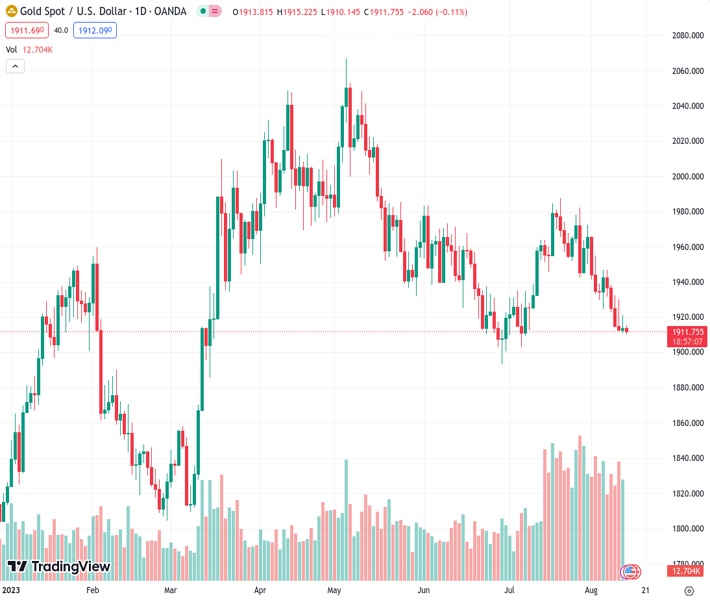
During the Asian session on Monday, the price of gold, represented by #XAUUSD, declined to its lowest point since July 7.
…
This is a premium post.
[s2If !current_user_can(access_s2member_level4)]Please register for FREE REGISTER to read full post below containing analysis. In case of any error or you think you are not able to read the full post below, please email us at support#nehcap.com [lwa][/s2If] [s2If current_user_can(access_s2member_level1)]
- Gold price slides to its lowest level since July 7 during the Asian session on Monday.
The pair currently trades last at 1911.58.
The previous day high was 1921.03 while the previous day low was 1910.92. The daily 38.2% Fib levels comes at 1917.17, expected to provide resistance. Similarly, the daily 61.8% fib level is at 1914.78, expected to provide resistance.
Gold price edges lower during the Asian session on Monday and drops to the $1,911-$1,910 region, or its lowest level since July 7 in the last hour. The intraday downtick, however, lacks follow-through selling, warranting caution for aggressive bearish traders and positioning for an extension of the recent downward trajectory witnessed over the past three weeks or so.
The prospects for further policy tightening by the Federal Reserve (Fed) lift the US Dollar to a fresh six-week peak and turn out to be a key factor acting as a headwind for the non-yielding Gold price. The bets were reaffirmed by the United States (US) Producer Price Index (PPI) on Friday, which climbed slightly more than expected in July. In fact, the US Bureau of Labor Statistics reported that the PPI for final demand rose 0.8% on a yearly basis during the reported month, up sharply from a flat reading in June.
Against the backdrop of a moderate increase in consumer prices in July, the data suggested that the battle to bring inflation back to the Fed’s 2% target is far from being won. The outlook keeps the door for one more 25 basis points (bps) Fed rate hike move by the end of this year wide open and remains supportive of a further rise in the US Treasury bond yields. This, in turn, continues to act as a tailwind for the Greenback and exerts some downward pressure on the US Dollar-denominated Gold price.
That said, concerns about the worsening economic conditions in China, along with geopolitical risks, could lend some support to the safe-haven XAU/USD and help limit the downside, at least for the time being. In the latest development, a Russian warship fired warning shots at a cargo ship in the southwestern Black Sea on Sunday. This comes after Russia in July halted its participation in a landmark UN-brokered grain deal that allowed Ukraine to export agricultural products via the Black Sea.
Nevertheless, the aforementioned fundamental backdrop seems tilted firmly in favour of bearish traders and suggests that the path of least resistance for the Gold price remains to the downside. Hence, any attempted recovery is more likely to get sold into and runs the risk of fizzling out rather quickly. In the absence of any relevant market-moving economic data on Monday, the USD price dynamics will continue to play a key role in influencing the XAU/USD and producing short-term trading opportunities.
Technical Levels: Supports and Resistances
XAUUSD currently trading at 1911.04 at the time of writing. Pair opened at 1913.83 and is trading with a change of -0.15 % .
| Overview | Overview.1 | |
|---|---|---|
| 0 | Today last price | 1911.04 |
| 1 | Today Daily Change | -2.79 |
| 2 | Today Daily Change % | -0.15 |
| 3 | Today daily open | 1913.83 |
The pair is trading below its 20 Daily moving average @ 1948.12, below its 50 Daily moving average @ 1941.39 , below its 100 Daily moving average @ 1966.39 and above its 200 Daily moving average @ 1901.96
| Trends | Trends.1 | |
|---|---|---|
| 0 | Daily SMA20 | 1948.12 |
| 1 | Daily SMA50 | 1941.39 |
| 2 | Daily SMA100 | 1966.39 |
| 3 | Daily SMA200 | 1901.96 |
The previous day high was 1921.03 while the previous day low was 1910.92. The daily 38.2% Fib levels comes at 1917.17, expected to provide resistance. Similarly, the daily 61.8% fib level is at 1914.78, expected to provide resistance.
Note the levels of interest below:
- Pivot support is noted at 1909.49, 1905.15, 1899.38
- Pivot resistance is noted at 1919.6, 1925.37, 1929.71
| Levels | Levels.1 |
|---|---|
| Previous Daily High | 1921.03 |
| Previous Daily Low | 1910.92 |
| Previous Weekly High | 1946.82 |
| Previous Weekly Low | 1910.92 |
| Previous Monthly High | 1987.54 |
| Previous Monthly Low | 1902.77 |
| Daily Fibonacci 38.2% | 1917.17 |
| Daily Fibonacci 61.8% | 1914.78 |
| Daily Pivot Point S1 | 1909.49 |
| Daily Pivot Point S2 | 1905.15 |
| Daily Pivot Point S3 | 1899.38 |
| Daily Pivot Point R1 | 1919.60 |
| Daily Pivot Point R2 | 1925.37 |
| Daily Pivot Point R3 | 1929.71 |
[/s2If]
Download Nehcap EAWe have two EAs that are operational on our LIVE accounts.
- EA-FIX: Check out the details here. Download EA-FIX . EA-FIX is a non-grid HFT scalper.
- EA-GROWTH: High quality low dd EA using trend grids. Download EA_GROWTHJoin Our Telegram Group
")


