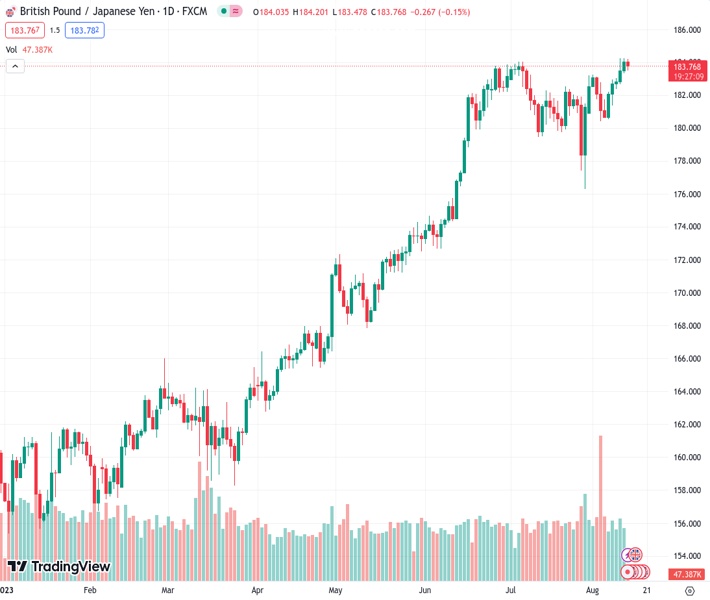
The GBPJPY currency pair, currently trading at 183.768, ends its five-day upward trend as selling pressure pushes it to a new intraday low. This comes after the pair reached a multi-year high last week.
…
This is a premium post.
[s2If !current_user_can(access_s2member_level4)]Please register for FREE REGISTER to read full post below containing analysis. In case of any error or you think you are not able to read the full post below, please email us at support#nehcap.com [lwa][/s2If] [s2If current_user_can(access_s2member_level1)]
- GBP/JPY snaps five-day uptrend as it takes offers to refresh intraday low after refreshing multi-year high the last week.
The pair currently trades last at 183.768.
The previous day high was 184.25 while the previous day low was 183.42. The daily 38.2% Fib levels comes at 183.93, expected to provide resistance. Similarly, the daily 61.8% fib level is at 183.73, expected to provide support.
GBP/JPY takes offers to refresh the intraday low near 183.50 during the first loss-making day in six amid early Monday morning in Asia. In doing so, the cross-currency justifies the market’s sour mood amid a light calendar, as well as ignores the hawkish concerns about the Bank of England.
Concerns about the UK’s heating inflation and firmer Treasury bond yields previously fuelled the GBP/JPY prices toward the highest level since late 2008. That said, in the latest survey from the UK’s Chartered Institute of Personnel and Development (CIPD), human resources executives expected to increase basic pay rates by a median of 5% – unchanged from the previous two quarters and the joint-highest readings since the survey started in 2012. The CIPD poll also adds that the public sector pay expectations rose to the record high of 4.0% from 3.3%. The same escalates pressure on the Bank of England (BoE) to lift the rates amid heating inflation.
Previously, the UK economy unexpectedly grew in Q2, up 0.2%. UK GDP lifted 0.2% q/q in June, which, while low, was stronger than expectations of a flat outturn, and meaningful in the context of annual growth of just 0.4%. UK industrial production lifted 1.8% m/m in June, soundly beating expectations of just a 0.2% increase. Manufacturing output was up 2.4% m/m.
It’s worth noting that the Bank of Japan’s (BoJ) offers to buy Japan Government Bonds (JGBs) seem to check the GBP/JPY buyers of late.
Elsewhere, Russia’s firing of warning shots at a warship in the Black Sea joins the US-China trade/technology war to propel the yields and put a floor under the GBP/JPY prices.
Against this backdrop, S&P500 Futures remain dicey while the US Treasury bond yields edge higher amid Monday’s sluggish Asian session.
Moving on, this week’s UK employment, inflation and Retail Sales numbers will be crucial for the GBP/JPY traders to watch for clear directions amid the likely hawkish move of the BoE. Also important will be Japan’s inflation clues and bond market moves.
Although the overbought RSI line triggered the GBP/JPY pullback, the pair’s upside momentum remains accepted unless the quote provides a daily closing beneath a five-week-old rising support line, close to 182.90 by the press time.
Technical Levels: Supports and Resistances
GBPJPY currently trading at 183.74 at the time of writing. Pair opened at 184.04 and is trading with a change of -0.16% % .
| Overview | Overview.1 | |
|---|---|---|
| 0 | Today last price | 183.74 |
| 1 | Today Daily Change | -0.30 |
| 2 | Today Daily Change % | -0.16% |
| 3 | Today daily open | 184.04 |
The pair remains strongly bullish on the daily timeframe. It trades above its 20 SMA @ 181.76, 50 SMA 180.86, 100 SMA @ 174.68 and 200 SMA @ 168.61.
| Trends | Trends.1 | |
|---|---|---|
| 0 | Daily SMA20 | 181.76 |
| 1 | Daily SMA50 | 180.86 |
| 2 | Daily SMA100 | 174.68 |
| 3 | Daily SMA200 | 168.61 |
The previous day high was 184.25 while the previous day low was 183.42. The daily 38.2% Fib levels comes at 183.93, expected to provide resistance. Similarly, the daily 61.8% fib level is at 183.73, expected to provide support.
Note the levels of interest below:
- Pivot support is noted at 183.56, 183.07, 182.73
- Pivot resistance is noted at 184.39, 184.73, 185.22
| Levels | Levels.1 |
|---|---|
| Previous Daily High | 184.25 |
| Previous Daily Low | 183.42 |
| Previous Weekly High | 184.25 |
| Previous Weekly Low | 180.58 |
| Previous Monthly High | 184.02 |
| Previous Monthly Low | 176.32 |
| Daily Fibonacci 38.2% | 183.93 |
| Daily Fibonacci 61.8% | 183.73 |
| Daily Pivot Point S1 | 183.56 |
| Daily Pivot Point S2 | 183.07 |
| Daily Pivot Point S3 | 182.73 |
| Daily Pivot Point R1 | 184.39 |
| Daily Pivot Point R2 | 184.73 |
| Daily Pivot Point R3 | 185.22 |
[/s2If]
Download Nehcap EAWe have two EAs that are operational on our LIVE accounts.
- EA-FIX: Check out the details here. Download EA-FIX . EA-FIX is a non-grid HFT scalper.
- EA-GROWTH: High quality low dd EA using trend grids. Download EA_GROWTHJoin Our Telegram Group
")


