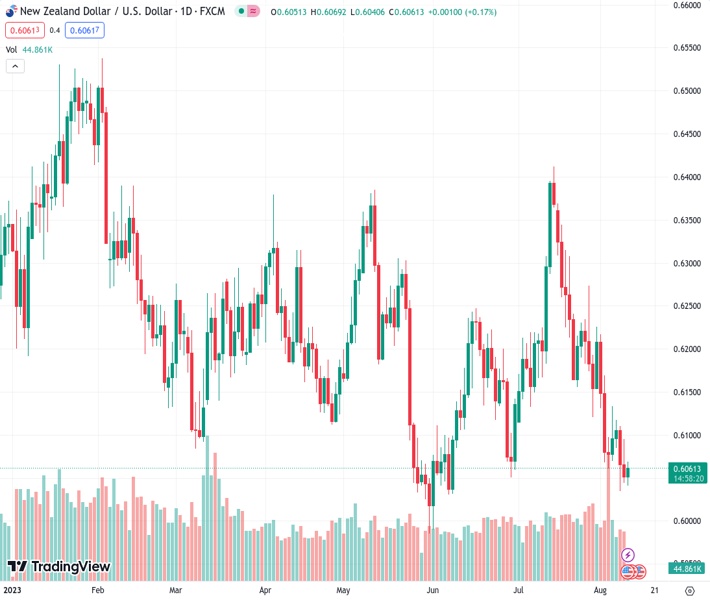
The New Zealand dollar to US dollar exchange rate, currently at 0.60623, is holding onto slight gains as traders in New Zealand prepare for the release of US CPI data. This follows the Reserve Bank of New Zealand’s inflation expectations which were positive for buyers.
…
This is a premium post.
[s2If !current_user_can(access_s2member_level4)]Please register for FREE REGISTER to read full post below containing analysis. In case of any error or you think you are not able to read the full post below, please email us at support#nehcap.com [lwa][/s2If] [s2If current_user_can(access_s2member_level1)]
- NZD/USD clings to mild gains as Kiwi traders brace for US CPI after RBNZ inflation expectations favored buyers.
The pair currently trades last at 0.60623.
The previous day high was 0.6096 while the previous day low was 0.6044. The daily 38.2% Fib levels comes at 0.6064, expected to provide resistance. Similarly, the daily 61.8% fib level is at 0.6076, expected to provide resistance.
NZD/USD remains sidelined near 0.6065-70 during the first positive day in three amid early Thursday morning in Europe. In doing so, the Kiwi pair justifies the previous day’s upbeat inflation signals from the Reserve Bank of New Zealand (RBNZ) survey while preparing for the US Consumer Price Index (CPI) for July, up for publishing at 12:30 GMT.
The Reserve Bank of New Zealand’s (RBNZ) Inflation Expectations for the third quarter (Q3) of 2023 flashed mixed results as the two-year inflation expectations, seen as the time frame when RBNZ policy action will filter through to prices, rose slightly to 2.83% in Q3 from 2.79% prior. However, New Zealand’s 2023 average one-year inflation expectations fell further to 4.17% for Q3 vs. 4.28% prior.
On the other hand, hopes of witnessing softer US inflation data, based on the early signals flashed the last week, join the market’s preparations for the likely hawkish surprise from the RBNZ during next week’s monetary policy announcements to propel the NZD/USD prices.
Further, the recently downbeat MBA Mortgage Applications, falling for the third consecutive week of late, also test the DXY bulls, especially amid the growing chatters of the Federal Reserve’s (Fed) policy pivot, which in turn puts a floor under the Kiwi prices. It should be noted that the CME Group FedWatch Tool shows that markets are pricing in an 86.0% chance that the Federal Reserve will pause interest rate hikes at its meeting in September.
With this, the Kiwi pair also justifies cautious optimism in the Asia-Pacific zone despite the US-China and the Sino-UK tension. That said, Financial Times (FT) came out with the news suggesting that UK Prime Minister Rishi Sunak is weighing whether to follow US President Joe Biden in restricting outbound investment into the Chinese tech sector, including artificial intelligence, chips and quantum computing. Before that, US President Joe Biden signed the much-awaited bill that allows the US Treasury Department to prohibit or restrict certain US investments in Chinese entities, per Reuters.
Against this backdrop, S&P500 Futures print mild gains despite Wall Street’s downbeat closing whereas the US Treasury bond yields also pare weekly losses.
Looking ahead, today’s US CPI becomes crucial due to the recently downbeat US employment data and disappointing early signals for the price pressure. Hence, an upbeat outcome can defy concerns that the Fed is near its peak rate and may recall the pair bears.
Failure to provide daily closing beneath June’s bottom of 0.6050 joins an oversold RSI (14) line to trigger the NZD/USD pair’s corrective bounce. However, the Kiwi buyers remain off guard unless crossing a one-month-old falling resistance line, close to 0.6135 at the latest.
Technical Levels: Supports and Resistances
NZDUSD currently trading at 0.6062 at the time of writing. Pair opened at 0.6052 and is trading with a change of 0.17% % .
| Overview | Overview.1 | |
|---|---|---|
| 0 | Today last price | 0.6062 |
| 1 | Today Daily Change | 0.0010 |
| 2 | Today Daily Change % | 0.17% |
| 3 | Today daily open | 0.6052 |
The pair remains strongly bearish on the daily time frame. It trades below the 20 SMA @ 0.6191, 50 SMA 0.6167, 100 SMA @ 0.6189 and 200 SMA @ 0.6232.
| Trends | Trends.1 | |
|---|---|---|
| 0 | Daily SMA20 | 0.6191 |
| 1 | Daily SMA50 | 0.6167 |
| 2 | Daily SMA100 | 0.6189 |
| 3 | Daily SMA200 | 0.6232 |
The previous day high was 0.6096 while the previous day low was 0.6044. The daily 38.2% Fib levels comes at 0.6064, expected to provide resistance. Similarly, the daily 61.8% fib level is at 0.6076, expected to provide resistance.
Note the levels of interest below:
- Pivot support is noted at 0.6032, 0.6012, 0.598
- Pivot resistance is noted at 0.6084, 0.6116, 0.6136
| Levels | Levels.1 |
|---|---|
| Previous Daily High | 0.6096 |
| Previous Daily Low | 0.6044 |
| Previous Weekly High | 0.6226 |
| Previous Weekly Low | 0.6060 |
| Previous Monthly High | 0.6413 |
| Previous Monthly Low | 0.6120 |
| Daily Fibonacci 38.2% | 0.6064 |
| Daily Fibonacci 61.8% | 0.6076 |
| Daily Pivot Point S1 | 0.6032 |
| Daily Pivot Point S2 | 0.6012 |
| Daily Pivot Point S3 | 0.5980 |
| Daily Pivot Point R1 | 0.6084 |
| Daily Pivot Point R2 | 0.6116 |
| Daily Pivot Point R3 | 0.6136 |
[/s2If]
Download Nehcap EAWe have two EAs that are operational on our LIVE accounts.
- EA-FIX: Check out the details here. Download EA-FIX . EA-FIX is a non-grid HFT scalper.
- EA-GROWTH: High quality low dd EA using trend grids. Download EA_GROWTHJoin Our Telegram Group
")


